Optimizing and Profiling During the Samsung Galaxy GameDev-Fortnite Collaboration
Introduction
Fortnite is the longest-lasting collaborative project undertaken by the Galaxy GameDev team, starting back in February 2018. We worked on Fortnite for over a year with Epic Games, both in Korea and in Cary, North Carolina.
Each game and each game developer needs unique treatment. Each development camp raises different challenges, requires different techniques, and sometimes targets different rendering quality. The issues that are raised and the performance levels that must be reached always vary, so different optimizations need to be applied to each game.
Fortnite is developed directly by Epic Games, which makes it a good test-bed for checking for bugs and performance problems in the latest version of Unreal Engine. Once the optimizations that we applied for Fortnite had been proven to be stable, they could be incorporated into the main Unreal Engine branch for the next release. Unreal Engine already offered some support for game development using Vulkan, but Samsung’s work on UE4 helps game developers to achieve better performance - and this was the main goal of our involvement in the project.
This article identifies significant areas that we worked on during the project, including how we optimized performance in collaborating with Epic Games, we resolved confronted issues.
First Steps
Analysis
The first tasks during the collaboration were analysis and support of the OpenGL ES build, and implementing a basic Vulkan back end for the renderer: Unreal Engine already had some experimental Vulkan support, but we needed the code to be more production-ready before proper optimization could begin. This initial level of UE4 Vulkan support meant that we could properly compare GLES and Vulkan performance.
Mature GLES drivers achieve good performance by containing many application-specific code paths and heuristics. However, these optimizations add some overheads that “bloat” the driver for new, well-written applications. The more explicit Vulkan API can avoid the overhead of this “driver magic”, and we found that our initial Vulkan rendering implementation already outperformed the GLES code even before we prioritised optimization. However, the Vulkan code path sometimes exhibited rendering issues which needed to be fixed.
The performance figures in the diagram above come from a Mali device during our initial profiling of our new Vulkan code. They showed that 100% of the GPU performance was being used. However, another performance measurement result from an Adreno device, shown below, showed that it used less of the available GPU resources than Mali; we needed to be sure whether the low performance that we were seeing was limited by the GPU or CPU. On further investigation, we found that the appearance of being GPU-bound on Mali was a bug of the GameBench tool - and that in fact Fortnite was a CPU-bound case.
OpenGL ES 17 FPS | CPU 10% GPU 31% | Limited by the CPU
Vulkan 49 FPS | CPU 17% GPU 82% | Balanced load, but Vulkan still had a CPU burden
For confirmation that this discovery was correct, we performed tests that limited the CPU and GPU clock speeds to confirm which side was causing the bottleneck. Results are shown in the table below. When both the CPU and GPU clock speeds were restricted, performance was just 10.8 FPS. When only the GPU was restricted, we achieved 18.4 FPS - a much higher performance than we saw in the first test. With only the CPU limited in clock speed, we saw a figure of 11.7 FPS - not very different from the first run. These results gave us confidence that the game was indeed CPU bound.
CPU/GPU clock
1170/338
Max/338
1170/Max
FPS
10.8
18.4
11.7
Lesson_1Check what you're told, even by your tools.
Project Investigation
At this point we knew that the biggest performance problem was caused by excessive CPU usage. Next, we needed to figure out more detail: what part of the game was using the CPU so much?
We used many tools to investigate this problem, and found a performance drop which applied only to Vulkan by examining the RHI stats of Unreal Engine: a large amount of time was spent in resetting queries and waiting for queries.
We also found that a specific scene exhibited a big performance drop in comparison with GLES. According to RHI Stat, in that scene, vkUpdateDescriptorSet was called more than 300 times, with setUniformBuffer called more than 1000 times - and both took a long time to execute.
This was the investigation that formed the basis of our work - we started optimization at this point.
Optimizing Performance
UpdateDescriptorSet and UpdatePackedUniformBuffer
Our first optimization was to introduce a cache for descriptor sets. In the common call stack, UpdateUniformBuffer was called before each draw call, and the uniform buffer was copied to a VkBuffer. The code then needed to allocate and update a descriptor set. If a descriptor set with this data is already in a cache, we could avoid the allocation and update. Since Fortnite has many draw calls, the cache can significantly reduce the number of allocates and updates, reducing the CPU load. The number of calls to vkUpdateDescriptorSet was reduced to two updates per frame on average.
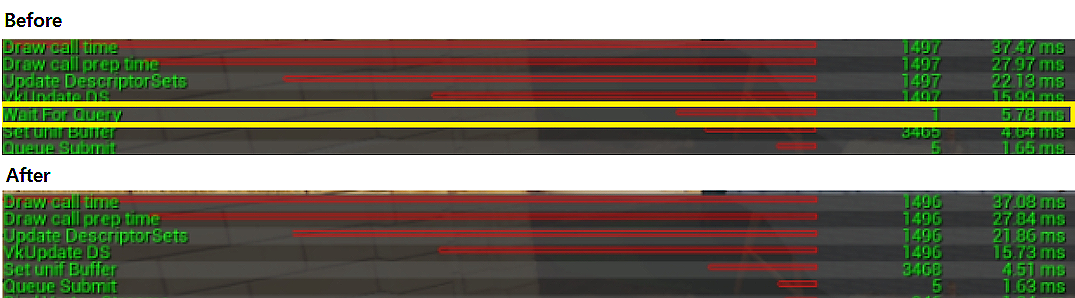
Execution time of the RHI thread before the descriptor set cache was implemented (top)
and the reduced time with the descriptor set cache (bottom)
We also switched to using dynamic uniform buffers (VK_DESCRIPTOR_TYPE_UNIFORM_BUFFER_DYNAMIC). These changes reduced the CPU bottleneck by reducing the number of calls to VkUpdateDescriptorSets.
The performance improvement that these changes provided depended on the number of draw calls in the scene. When we first captured the frame, it contained roughly 600 draw calls. After optimizing, vkUpdateDescriptorSets was called only half as frequently, and the total draw-call time reduced by more than 3 ms.
Halved time spent calling vkUpdateDescriptorSet before (top)
and after (bottom) the descriptor set cache was implemented
Lesson_2Try not to do work. If you find you do need to do something, don't ignore the possibility that there might be a better way of doing it.
Removing synchronization overhead
When these optimizations had reduced the load in Unreal Engine’s RHI thread, we saw an increase in hitching caused by a synchronization issue between the RHI thread and the main thread. An error in the synchronization code in the FRenderCommandFence class caused an unstable frame time, with the instability increasing as the RHI thread workload reduced. Fixing this synchronisation resulted in a stable frame rate.
Increase in hitches (time greater than 60ms) between the code
before the descriptor set cache was implemented (left) and after (right)
Unstable frame time before the fix
Stable frame time after the fix
Lesson_3Sometimes things have to get worse before they can get better.
Changing Query Managing Logic
Fortnite makes use of queries to perform occlusion culling - originally accomplished by using the method that is shown in the diagram below. Firstly, Unreal Engine would create multiple global query pools for allocation. It would then call vkGetQueryResults to get the results of each query, and finally reset the query pools individually after it was finished with the result. For example, when the game requested 13 queries, Unreal Engine would perform 13 separate allocations for queries, and call vkGetQueryResults 13 separate times.
The Vulkan API entry points for getting query results and resetting queries can process multiple individual queries in a single call. To take advantage of this, we modified the query logic to use a dedicated query pool for each frame, rather than keeping a global pool. We could then get the query results collectively or reset all of the queries with a single function call on that query pool.
After our change, if the game requested N queries, Unreal Engine would then allocate a single query pool for that frame, and allocates N queries out of that pool. The game then only needed a single function call to access all the query results for this dedicated pool, and a single function call to reset all the queries in the pool collectively.
What performance benefit did this give us? After changing to the new way of managing queries, performance increased by 2 FPS, and frame rate stability also improved by 15%.
Median FPS
FPS Stability
CPU Usage
GPU Usage
Before
27
75%
16.32%
70.9.%
After
29(+2)
90%(+15%)
15.55%
79.52%
You can see these results more clearly in the below FPS graph: after the change, the graph shows more stability in frame rate and reduces many of the cases of lag.
Lesson_4Batch up work when you can.
Waiting for Queries
Unreal Engine initially allowed for a latency of two frames when waiting for occlusion query results - which would be sufficient for many desktop architectures. However, Android uses a three-deep swapchain back buffer. By only allowing a latency of two frames between occlusion query submission and trying to access the occlusion query results, the application was made to stall for an additional frame until the results became available. We could remove this unnecessary waiting time by increasing the query-read latency to three frames.
These were the optimization points that we found in our first pass. After further investigation, we found more opportunities for improvement.
Lesson_5If things lie in a dependency chain make sure the chain is long enough to stop it from holding you back.
Merging Render Passes and Removing Unnecessary Barriers
A capture from RenderDoc showed that the Render Pass management code was inefficient.
When Unreal Engine 4 sets a new RenderTarget, it needs to create a RenderPass, create a Framebuffer, and begin the new RenderPass. There are caches for RenderPasses and Framebuffers: a hash is created from the set render target info, and this is used to get or create the RenderPass and Framebuffer. If we find we the new RenderPass and Framebuffer are the same as the one currently in use, we don’t need to begin a new RenderPass.
Unreal Engine sets the RenderTarget at the start of each pass. In the first example below, the first pass uses VK_ATTACHMENT_LOAD_OP_CLEAR and upscales the render target; the second pass uses VK_ATTACHMENT_LOAD_OP_LOAD and renders SlateUI, using the same render target but with a load operation. The hash value of the SlateUI pass is therefore different from the Upscale pass; this causes a new RenderPass to be started, but in fact the old one could continue to be used. The version with two render passes has additional load/store operations that are expensive to execute on a tiled architecture. Additional logic was added to the render pass compatibility checking to allow the render passes to be merged.
Even when the VkAttachmentLoadOp and VkAttachmentStoreOp match, sometimes a new render pass was being started redundantly due to unnecessary layout transitions, as in the decal and translucency passes. Removing the transitions allowed the operations to take place in a single render pass. The transitions not only caused a break into multiple render passes, but also introduced costly pipeline barriers:
This render pass merging increased the FPS we were able to achieve:
Lesson_6Don’t rely on the brute force of the GPU - see whether you can preprocess your inputs into something that will work better.
Making Vertex and Index Buffer Creation Asynchronous
The initial implementation of CreateVertex() and CreateIndexBuffer() functions caused Unreal Engine’s RHI thread to stall. However, the Vulkan version of the RHI allows asynchronous creation of vertex and index buffers - providing these removed a wait from the thread, reducing the number of hitches in the rendering thread.
Lesson_7If you’re on the critical path, delegate!
Removing the Staging Buffer for Static Buffers
Another opportunity for optimization that we found was to remove the redundant use of a staging buffer. On a desktop computer, the preferred way to use buffer data is to have a staging area into which the CPU writes; the GPU then copies this buffer data to local memory, where it can be most efficiently accessed. However, mobile devices have unified memory: a single buffer can be kept in common storage used by both the CPU and GPU, and there is no benefit to making an additional copy - no “faster” memory into which to copy it.
For mobile use, we could therefore remove the allocation of the unnecessary staging buffer and the process of copying data. However, we needed to add the “host visible” and “coherent” bits when creating the Vulkan buffer. We suggested including this approach in Unreal Engine, and it saved the execution time that would have been spent allocating the staging buffer and copying the data. Once this change had been incorporated, we saw reduced loading times and increased stability.
Loading Time(ms)
With Staging Buffer
Without Staging Buffer
Total
1,994,459
161.39
Average
327.6
0.021
Lesson_8Check whether costly operations are necessary given your knowledge about the system your code will run on…
Texture Upload Optimization
For efficient rendering, Vulkan allows textures to have an implementation-dependent representation for more optimal memory access. This means that a staging buffer is needed for texture upload, into which the image data is copied. A command buffer was then recorded to copy the image data from this staging buffer into the internal image, and this was submitted to the GPU, which would then perform the transformation of image representation.
Initially, this command buffer submission happened separately for each texture upload - 100 uploads caused 100 command buffers to be recorded, and vkQueueSubmit was called 100 times - this had a big CPU cost. An optimization was to record the upload commands into a single command buffer which could be submitted just once:
Lesson_9If Something is repetitive, find a way to do it only once.
Unreal Engine allocates memory in “pages” out of a heap. We found that many allocations caused an additional heap page to be allocated - a costly operation - but the increased amount of memory was only needed temporarily. Once memory requirements were reduced, a heap page was deallocated again - but the next allocation would have the same problem of needing a new heap page, as shown in orange in the below graph. We could optimize for this behavior: when heap pages are freed, at least a single 64MB unused heap page could be kept in reserve for future allocations. This modification removed hitching caused by frequent expensive release and reallocation. Additionally, we tracked memory heap pages separately for device images and buffers; this allowed us to reduce total memory usage.
Lesson_10Take a long-term view of the behavior of the system, especially when there are expensive operations involved...
Forcing Decals to be Visible
Unreal Engine uses different depth-stencil pipeline states depending on whether decals are visible in the game view. The change to depth-stencil states requires a new VkPipeline object - so this means the number of pipelines needed for most materials is doubled! The increase to the total pipeline count is critical for Mali devices with the Vulkan LRU pipeline eviction mechanism (described below) enabled. The total pipeline count increase is not the main problem: each time the decal visibility state changes, Unreal Engine will instantaneously request many new pipelines that likely had been evicted from the LRU mechanism and therefore have no VkPipeline objects - so a lot of Vulkan pipeline objects will be created in a single frame, causing a severe hitch.
In the following image, hundreds of Vulkan pipelines are created in a single frame, causing hitches:
After forcing decals to be visible, the amount of pipeline creation is greatly improved:
Lesson_11Sometimes doing the right thing is a lot slower than doing the wrong thing that still looks right.
Speeding Up "Optimizing Resources" and Reducing Hitches with Pipeline Creation
To speed up pipeline creation, the task was moved to the High Priority TaskGraph threads. These are created with Affinity = FGenericPlatformAffinity::GetNoAffinityMask(), meaning that they can be executed on any core, little or big. This increased the “Optimizing Resources” stage by nearly a factor of two compared with the base version - the below results are for the “Optimizing Resources” stage:
Device
Results
950U
187.6 → 96.4
965U
211.2 → 115.2
950F
425.2 → 165.1
965F
411.7 → 195.0
Lesson_12Make sure costly operations can be done in the right place.
Google Display Timing
We also implemented a new Frame Pacer, which has more accurate frame prediction than the existing mechanism: it recovers more quickly after hitching, and works better when there is no history from the driver. (In the previous version, if there is no history, frame time sometimes goes under 33.3ms @ 30fps).
Lesson_13Any functionality can be improved (especially if you can see clear issues).
Stability
Memory Leaks
Would you play a game that achieved 60 FPS with fancy graphics, but would suddenly quit because of a memory leak? We guess nobody would want to play a game that behaves like that - so it is critical to solve memory leak problems and optimize memory usage.
Early in the Fortnite collaboration, memory usage was a challenge we faced. Once the game had been played for a long time, Android would force-kill the application with “Out Of Memory” log messages. In this section, we’ll discuss approaches to investigating memory usage, and how we solved the problem.
How to Investigate Memory Usage
Our main approach to investigating anomalous memory usage utilized the Vulkan Object Layer that we created, which monitored the number of specific Vulkan objects which are currently allocated. This Vulkan layer hooks into the API, so we can trace the number of all Vulkan objects whenever they are created or destroyed. We also used Android dumpsys meminfo to trace the total amount of memory in use.
The graphs below show the results of dumpsys meminfo and of the Vulkan Object Layer. We could see from the graphs that total memory usage and the number of Vulkan objects in existence were increasing steadily, even when replaying the same scene repeatedly and not encountering any new content.
Optimizing Memory - Fixing Cache Miss Logic
The primary cause of the memory leak was found to be an error in the pipeline cache logic. Unreal Engine uses many hash maps for caching and creating new objects - but the problem in this case was that the code used pointers to calculate the hash value! Even when referring to the same pipeline, the pointer value could be different - and in this case, this caused the engine to create a redundant duplicate pipeline object.
To fix this error, we replaced all the pointers that were being used to calculate the pipeline state object hash with real variables, by making a new hashable structure. With the new structure, the pipeline cache hit rate increased, and we removed the memory leak. We also modified the key calculation for hashing descriptor set layouts, which decreased the number of layouts and improved the pipeline cache hit rate - a change which significantly helped both memory usage and performance.
We tested by replaying the same scene contents repeatedly. Before these changes were made the cache hit rate was only around 80%. After the fix, we could see the cache was being hit almost 100% of the time - and there was no longer a memory increment for looping replay.
This change also decreased the use of many redundant Vulkan objects. After playing three loops through the same content, the number of descriptor set layouts was reduced from over 17,000 to 500, and the number of pipeline layouts was reduced from around 9,000 to about 300.
We also found other optimizations - but none that had such a big impact on the performance as fixing the missing cache logic.
Lesson_14Check the long-term behaviour of your optimizations to confirm they’re working as intended
Optimizing Memory - Fixing the Texture Streaming Pool Size
Texture resolution made a big difference between Vulkan and GLES because the streaming pool size wasn’t being initialized. After adding initialization code, GPU memory was decreased by more than ~100 MB. This also reduced the GPU workload due to reducing the texture sampling cost and memory bandwidth.
Lesson_15Check you’ve initialised everything!
LRU Pipeline Eviction
Mali devices have a limitation on the amount of available shader memory. Fortnite creates a very large number of pipelines, far exceeding these limits. We implemented a least-recently-used tracker for Vulkan pipelines to manage this issue: the FVKPipelineLRU class. Using a heuristic we assign a predicted device shader memory size to each pipeline, and check whether creating a new Vulkan pipeline is expected to exceed the memory limit. If we predict that the limit would be exceeded, we delete the least-recently-used Vulkan pipeline. Whenever Unreal Engine uses a pipeline, a FVKPipelineLRU::Touch() method is called to mark it as most-recently used, and create the Vulkan pipeline if necessary.
This solution requires the creation and destruction of Vulkan pipelines during gameplay, and therefore has a negative impact on performance. Without this fix, it is unfortunately impossible to run the game at all on some Mali devices.
Lesson_16Sometimes you have to code for the lowest common denominator.
Conclusion : Vulkan vs GLES Comparison
We found many optimizations to apply to Fortnite during our collaboration with Epic Games. However, during the course of the year we had been working, Epic Games not only made large changes to content, but also made significant progress in optimizing GLES performance. This makes it hard to directly compare the results at the start and end of the project to measure how much of the improvement came from our work.
However, we can compare Vulkan and GLES through the performance data that we revealed to the public at SDC 2018: as you can see in the image below, at this point, Vulkan performance was 20% higher than GLES, and Vulkan also showed noticeably better frame rate stability. We could come away knowing that our hard work meant that customers would see smoother game play and higher frame rates using Vulkan!
Thanks to the GameDev Engineers : Igor Nazarov, Kostiantyn Drabeniuk, Sangmin Lee, Soowan Park, Seunghwan Lee, Junsik Kong, Dohyun Kim, Inae Kim, Munseong Kang, Joonyong Park, Anton Sinyavskiy, Sergey Pavliv, Nataliia Kozoriz, Fedir Nekrasov, Vadym Kosmin, Oleksii Vasylenko
Manage Your Cookies
We use cookies to improve your experience on our website and to show you relevant
advertising. Manage you settings for our cookies below.
Essential Cookies
These cookies are essential as they enable you to move around the website. This
category cannot be disabled.
Company
Domain
Samsung Electronics
developer.samsung.com, .samsung.com
Analytical/Performance Cookies
These cookies collect information about how you use our website. for example which
pages you visit most often. All information these cookies collect is used to improve
how the website works.
Company
Domain
Samsung Electronics
.samsung.com
Functionality Cookies
These cookies allow our website to remember choices you make (such as your user name, language or the region your are in) and
tailor the website to provide enhanced features and content for you.
Company
Domain
Samsung Electronics
developer.samsung.com, google.account.samsung.com
Preferences Submitted
You have successfully updated your cookie preferences.