Objective
Learn how to optimize the performance of a demo game on Samsung Galaxy devices using the Adaptive Performance in Unity. The Adaptive Performance package provides you with tools to properly adjust you’re game and improve its overall game performance.
Overview
Samsung devices include Android Dynamic Performance Framework (ADPF) support, which provides an interface between game applications and devices, helping developers optimize their games. This feature allows Unity developers to use it through the Unity Package Manager and further customize their game content using C# scripting.
The latest version of Adaptive Performance, now uses new Android APIs that gather information from Samsung hardware to provide more detailed insights into the device's thermal components and CPU optimization.
Adaptive Performance includes both the Android Provider and Simulator Provider. The Android Provider uses the ADPF APIs and is supported on devices running Android 12 or higher. The Simulator Provider enables the simulation of key ADPF features on desktop environments for development and testing purposes. This Code Lab focuses on using the Android Provider.
Thermal Throttling
Mobile devices lack active cooling systems, causing temperatures to rise. This triggers a warning to the Unity subsystems, which lowers hardware demand to control heat and avoid performance degradation.

The ideal goal is to make performance stable with low temperature. Adaptive Performance, primarily for performance and quality balance management, can help achieve this.

Thermal Warning
The warning system implemented in ADPF can trigger both internal Unity systems and developer-defined behaviors, such as disabling custom scripts and shaders.

Scalers
It also provides you with the option to adjust the game's quality to maintain stable performance at different warning levels. With Adaptive Performance enabled, the game's FPS becomes more stable and consistently higher over time.
The Adaptive Performance in Unity provides developers with scalers that affect various aspects of the game:
- Frame Rate
- Resolution
- Batching
- Level of Detail (LOD)
- Lookup Texture (LUT)
- Multisample Anti-aliasing (MSAA)
- Shadow Cascade
- Shadow Distance
- Shadow Map Resolution
- Shadow Quality
- Sorting
- Transparency
- View Distance
- Physics
- Decals
- Layer Culling
These general scalers can be used to scale the content based on your settings in the editor. However, you may also create custom scalers that integrate with your own systems. For instance, your own scalers can disable CPU-expensive scripts from running when thermal warnings are reached.
The latest version of Adaptive Performance, v5.0, includes new additions to the scalers:
- Decal scaler changes the draw distance of decals. It controls how far a decal can be before not being rendered.
- Layer culling scaler adjusts the distance that expensive layers, such as transparency or water, when they start being culled. It’s a useful scaler for scenes with more expensive shader calculations.
- In every frame, Unity calculates how all the physics in a level interacts with everything else, such as when the ball is dropping to the floor. Physics scaler adjusts the frequency at which this calculation is performed. A lower frequency means fewer CPU calculations per second.
Set up your environment
You will need the following:
- Unity Editor version 2022.3
- Visual Studio or any source code editor
- Supported Samsung Galaxy device
- Remote Test Lab (if physical device is not available)
- Requirements:
- Samsung account
- Java Runtime Environment (JRE) 7 or later with Java Web Start
- Internet environment where port 2600 is available
Sample Code
Here is a sample project for you to start coding in this Code Lab. Download it and start your learning experience!
Adaptive Performance Sample Code (903.96 MB)
Demo Game
The sample project contains a demo game named Boat Attack. It is an open-source demo game provided by Unity. It has the following features:
- Triangles: 800,000
- Vertices: 771,000
- Shadow casters: 133
Start your project
After downloading the sample project, follow the steps to open your project:
- Launch the Unity Hub.
- Click Projects > Open.

- After locating the unzipped project folder, you can open it in Unity Editor. It initially downloads the needed resources for your project.

- Open
benchmark_island-flythrough scene found under Assets.

NoteThe project was tested in Unity 2022.3. It is recommended to use this version in this Code Lab.
-
In Window > Package Manager > Adaptive Performance, you can check if the Adaptive Performance is already included in the project.
-
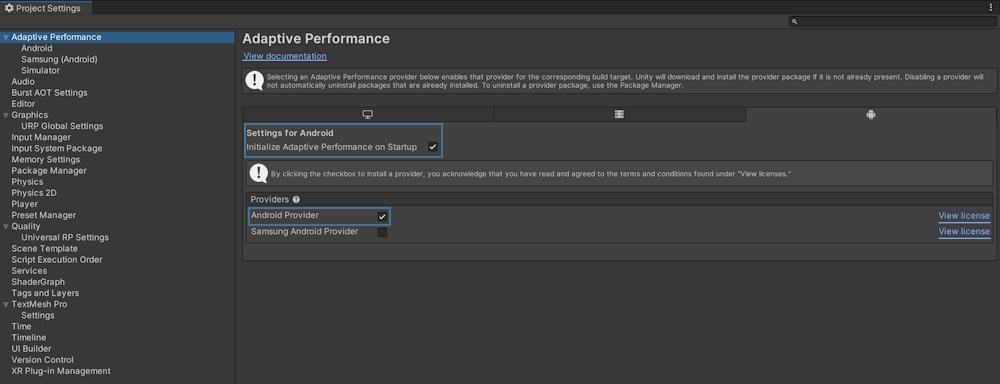
Go to Edit > Project Settings > Adaptive Performance. Enable the Initialize Adaptive Performance on Startup and select Android Provider.

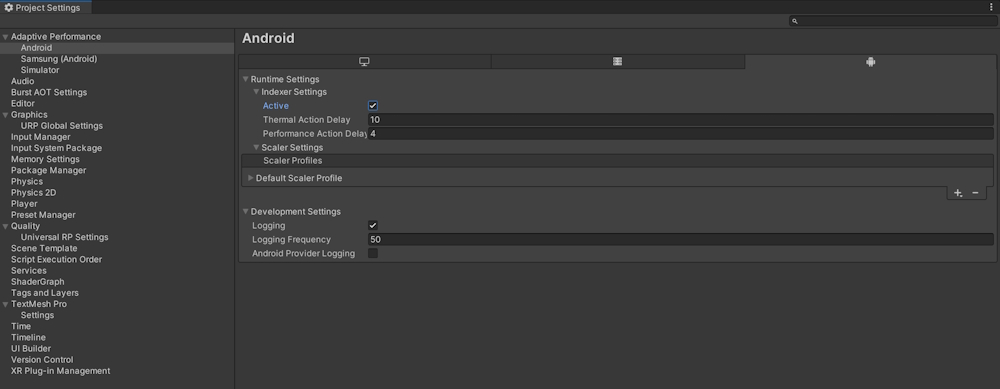
- Enable the scalers by going to Adaptive Performance > Android > Indexer Settings.

- Check the Scaler Settings and just use the default values.

You are going to use a script that contains examples of the Adaptive Performance API code. It gives you access to the frame time information, thermal information, and CPU/GPU bottlenecks. This script adjusts the performance based on the device's thermal state, allowing longer game time by reducing in-game demands.
- Download the Adaptive Performance script:
AdaptivePerformanceConroller.cs (6.0 KB)
- Simply drag and drop the script into Assets folder.

- Create a new object and attach the script to the object.

Change the frame rate based on thermal warnings
Get to know about thermal warnings
Throttling warnings allow you to know when your game is about to be forcibly throttled and have sections of lag and lowered frame rate. Adaptive Performance provides these thermal alerts that allow you to take control and adjust settings before the performance downgrades.
Check the registered event handler to trigger thermal status: IThermalStatus.ThermalStatus.ThermalEvent
Then, check ThermalMetrics information in the handler.
| Name
|
Description
|
Value
|
| NoWarning
|
No warning is the normal warning level during standard thermal state.
|
0
|
| ThrottlingImminent
|
If throttling is imminent, the application should perform adjustments to avoid thermal throttling.
|
1
|
| Throttling
|
If the application is in the throttling state, it should make adjustments to go back to normal temperature levels.
|
2
|
-
TemperatureLevel (0.0 ~ 1.0)
Current normalized temperature level in the range of [0, 1]. A value of 0 means standard operation temperature and the device is not in a throttling state. A value of 1 means that the maximum temperature of the device is reached and the device is going into or is already in throttling state.
-
TemperatureTrend (-1.0 ~ 1.0)
Current normalized temperature trend in the range of [-1, 1]. A value of 1 describes a rapid increase in temperature. A value of 0 describes a constant temperature. A value of -1 describes a rapid decrease in temperature. It takes at least 10s until the temperature trend may reflect any changes.
Adjust the frame rate
In the AdaptivePerformanceController.cs, the following code is responsible for changing the frame rate depending on the current thermal alert:
void OnThermalEvent(ThermalMetrics ev)
{
    switch (ev.WarningLevel)
    {
        case WarningLevel.NoWarning:
            Application.targetFrameRate = 60;
            break;
        case WarningLevel.ThrottlingImminent:
            Application.targetFrameRate = 30;
            break;
        case WarningLevel.Throttling:
            Application.targetFrameRate = 15;
            break;

    }
}
Change the quality settings
The performance bottleneck API informs you via an enum value if there is a bottleneck so you can adjust the workload:
IAdaptivePerformance.PerformanceStatus.PerformanceMetrics.PerformanceBottleneck
namespace UnityEngine.AdaptivePerformance
{
    public enum PerformanceBottleneck
    {
        Unknown = 0,
        CPU = 1,
        GPU = 2,
        TargetFrameRate = 3
    }
}
In the AdaptivePerformanceController.cs script, the code below is responsible for controlling the LOD of the models depending on the performance bottleneck. A model with multiple LOD is a prime example of a quality setting that can heavily affect the games performance. Lowering it lessens the load on the GPU, frees up resources, and eventually prevents thermal throttling.
Change the quality setting by adjusting LOD in real time by using the PerformanceBottleneck API.
switch (ap.PerformanceStatus.PerformanceMetrics.PerformanceBottleneck)  // IAdaptivePerformance.PerformanceStatus.PerformanceMetrics.PerformanceBottleneck
        {
            case PerformanceBottleneck.GPU:
                Debug.LogFormat("[ADP] PerformanceBottleneck.GPU ");
                LowerLOD();
				break;
            case PerformanceBottleneck.CPU:
                Debug.LogFormat("[ADP] PerformanceBottleneck.CPU ");
                break;
            case PerformanceBottleneck.TargetFrameRate:
                Debug.LogFormat("[ADP] PerformanceBottleneck.TargetFrameRate ");
                break;
            case PerformanceBottleneck.Unknown:
                Debug.LogFormat("[ADP] PerformanceBottleneck.Unknown");
                break;
        }
Create a custom scaler
To create custom scalers, you need to create a new class that inherits from AdaptivePerformanceScaler. The Adaptive Performance package includes this class that can be added to the adaptive performance framework, which adjusts quality settings based on Unity's thermal settings.
- Download this custom scaler to control the texture quality of the demo game:
textureScaler.cs (1.17 KB)
- Simply drag and drop the downloaded file into the project.
Test using device simulator in Unity
The device simulator in Unity allows you to test out Adaptive Performance functionality without a physical mobile device.
- Go to Window > General > Device Simulator.

-
Go to Edit > Project Settings > Adaptive Performance. Enable the Initialize Adaptive Performance on Startup and select Device Simulator Provider.
-
In the device simulator, you can try to send thermal warnings and create artificial bottlenecks to test different behaviors of the demo game.
-
The visual scripts display the scalers available and show if it is enabled. Enabling a specific scaler means that the adaptive performance w You can override the scalers to test their impact on the demo game's performance and scene. Some scalers may not affect the scene but may improve the performance in the long run.

Build and launch the APK
- Go to File > Build Settings.
- Connect your Galaxy device. Enable Development Build and select Scripts Only Build option.
- Make sure that the Autoconnect Profiler is enabled to check the Profiler in Unity and measure the performance.

- In Build to Device, click the Patch button to install or update the APK in your device.
Test using Unity Profiler
Unity has also introduced a new module in its Profiler that allows you to monitor the scalers changes and extract frame time information to your editor. The Profiler allows you to get real-time information from the adaptive performance plugin.
- Navigate to Windows > Analysis > Profiler.

- Set the Play Mode to your connected Galaxy device.

- Once connected, you can analyze the frame time stats and check the state of the scalers during runtime.

Scalers in this Profiler are reacting to the thermal trend and are being raised or lowered in response to the thermal warning.
Observe the scalers when enabled or disabled
Texture scaler
The texture scaler is the custom script to lower the texture quality based on thermal levels. When enabled and maxed out, the texture fidelity has been lowered. This lowers the GPU load and memory usage.

LOD scaler
You may notice a subtle change in the appearance of the rocks, trees, and umbrella models. This is due to the adaptation of the LOD bias that determines which version of the models to use. As the thermal levels rise, lower poly models are selected to reduce the number of triangles rendered. This reduces the GPU load and minimizes thermal build-up.

Shadow map resolution
Shadow map resolution creates a blurring effect on the shadows which incidentally lowers the performance load required to render them. Basically, lower shadow detail means fewer GPU calculations, which lead to less heat build-up.

GPUWatch is a profiling tool for observing GPU activity in your app. The following are the common information shown by the GPUWatch:
- FPS counters
- CPU and GPU load
It is very helpful in profiling your game during the post-development stage so you can further optimize. To enable GPUWatch on your Galaxy device:

You can easily reposition the GPUWatch widgets on the screen by enabling Unlock widgets under the notification menu of GPUWatch.

You’re done!
Congratulations! You have successfully achieved the goal of this Code Lab. Now, you can improve and optimize your Android game on Samsung Galaxy devices using Adaptive Performance in Unity by learning about scalers, thermal warnings, and bottleneck APIs. The performance of your mobile games can be pushed further by utilizing these tools. If you face any trouble, you may download this file:
Adaptive Performance Complete Project (1.0 GB)
To learn more, visit:
developer.samsung.com/galaxy-gamedev


