Easy Steps to Capture and Collect Logs from Galaxy Watch
Shamima Nasrin
Engineer, Samsung Developer Program
The dumpstate log on Galaxy Watch running Wear OS powered by Samsung is a detailed system diagnostic report that captures everything happening on the watch at a specific moment. Samsung Developers or Samsung support can use it to troubleshoot issues (like application crashes, lag, excessive battery drain, or sensor failures), crucial operations, and application failures that can’t be diagnosed from application logs alone. In short, the dumpstate log is the go-to tool for deep debugging and capturing everything from application behavior to hardware status in one file.
The purpose of this tutorial is to discuss the procedure of collecting dumpstate logs on Galaxy Watch with or without a connected mobile phone.
This tutorial demonstrates three processes of generating a log from your Galaxy Watch:
- Generate a watch dump from Galaxy Watch
- Generate a watch dump from a connected Galaxy phone
- Generate a watch dump using the Galaxy Wearable application
Prerequisites
If you are using an operating system that uses One UI 6 or newer (Android version 14), disable the auto blocker before collecting the log.
Before proceeding with one of the options below, make sure Developer Mode on your watch is enabled, which gives access to the Developer options menu.
To enable Developer Mode:
a) Go to Settings > About watch > Software information.
b) Tap on Software version 5 times. This enables Developer Mode and makes Developer options visible in the Settings. After successfully enabling Developer Mode, a toast message also appears on the screen.
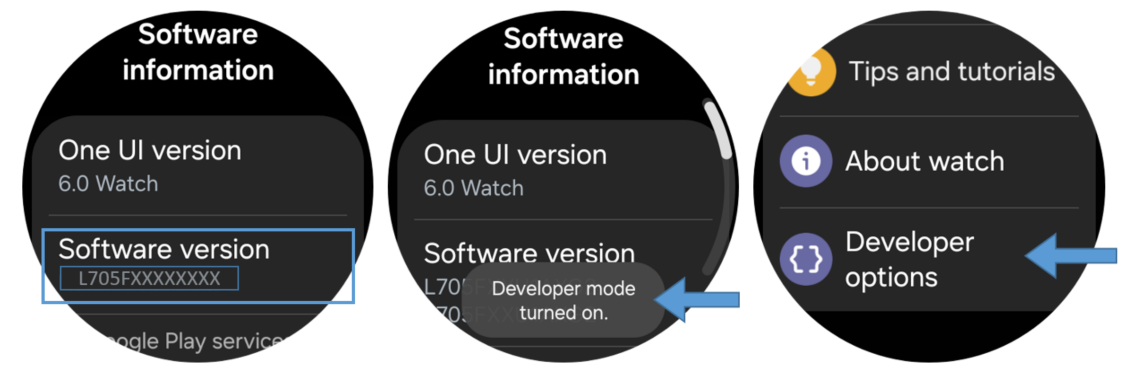
Figure 1: Enabling Developer Options from Settings
Option 1: Generate a Watch Dump from Galaxy Watch
a) Go to Call and dial *#9900#. The SysDump tool will be launched. Scroll down and select DELETE DUMPSTATE/LOGCAT.
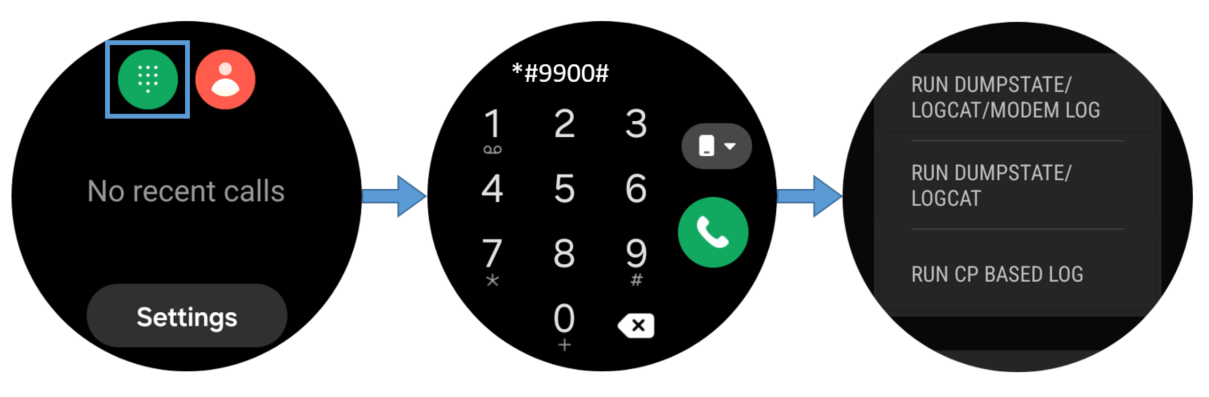
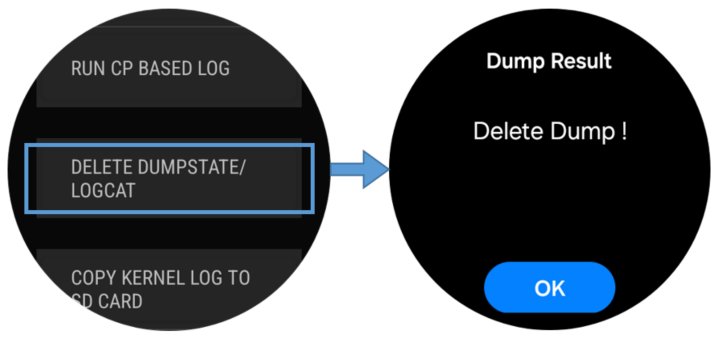
Figure 2: Deleting the dumpstate log
b) Dial *#9900# again. In the SysDump tool window, select DEBUG LEVEL DISABLED/LOW and set it to MID. This restarts the watch.
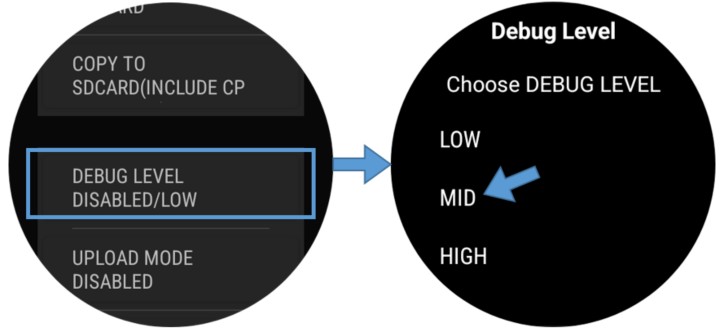
Figure 3: Setting the debug level to MID
c) Reproduce the issue/scenario you want to capture in your log.
d) Dial *#9900#, select RUN DUMPSTATE/LOGCAT, and wait a few minutes until it finishes.
You will be redirected to the System Dump Tool.
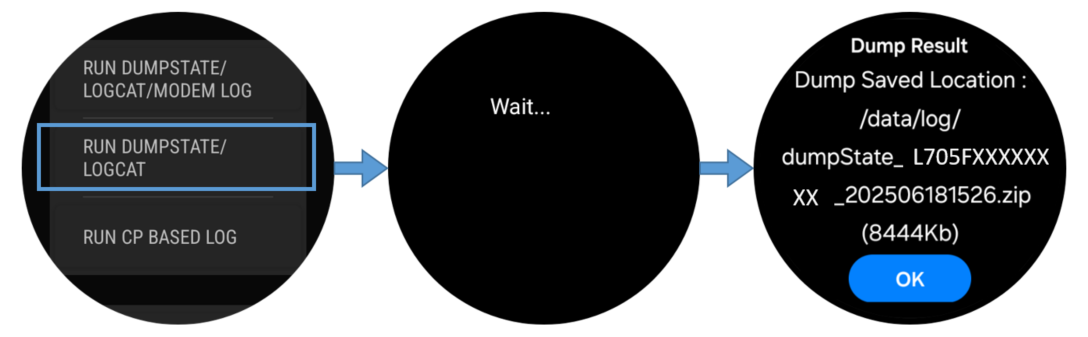
Figure 4: Running and saving the dumpstate log
e) When the process is finished, select COPY TO SD CARD (INCLUDE CP RAMDUMP). The log file is saved to the watch’s internal storage.
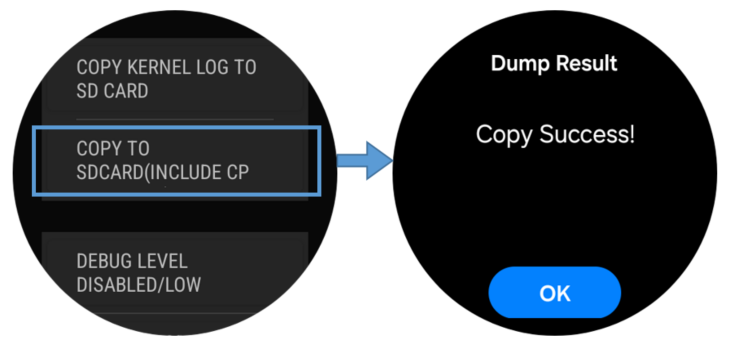
Figure 5: Copy to SD card
f) In the main (root) directory of the watch's file system, look for the “log” directory, which contains the newly generated dumpstate log file. The file has the name format: "dumpstate_WATCH MODEL_TIMESTAMP".
Collect the Log File from Galaxy Watch
Connect your watch with the PC. Follow the section “Use the command line” from the Connecting Galaxy Watch to Watch Face Studio over Wi-Fi guide to set up a connection between your watch and PC using ADB. No active internet connection is required. Just make sure both your PC and watch are on the same network (check both IPs for confirmation).
You can collect the generated log in two ways:
- Using the PC UI:
After connecting the watch to the PC, in the internal storage of your watch, you will find the "log" file. Compress the file and share it with the support team if asked.
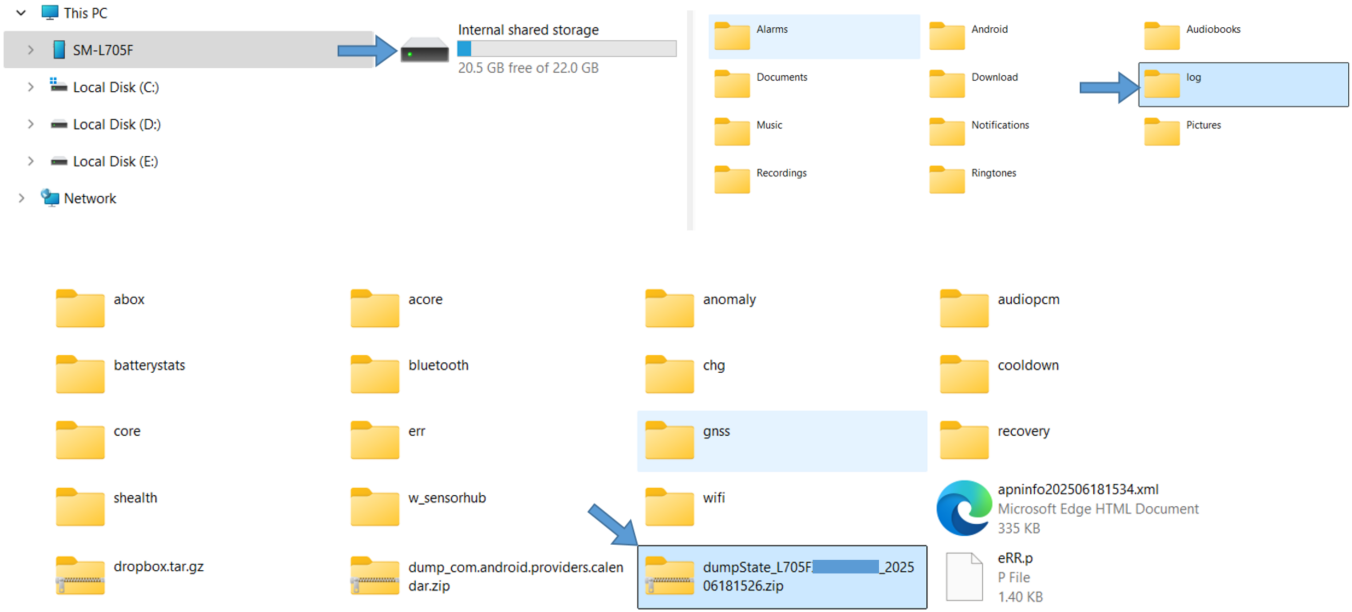
Figure 6: Connect the watch to your PC and collect the log folder from storage
- Using ADB and CLI:
Use the following commands in the command prompt to collect the log:
Check if the log file is saved or not-
adb shell ls /sdcard
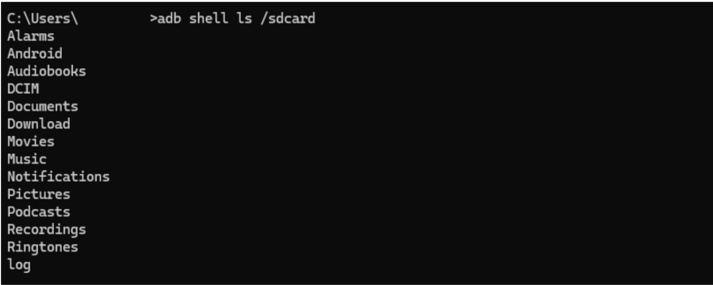
Figure 7: Check the log file existence
You will see the log file in the list (see figure 7). If you skipped the step “COPY TO SD CARD (INCLUDE CP RAMDUMP)” in the previous section, then no log file will be listed and the message “No such file or directory” is shown instead.
Pull the log to your PC storage-
adb pull /sdcard/log

Figure 8: Pull the log from your Galaxy Watch to your PC
This will start to pull the log file from your watch. It may take a few minutes to complete the process.
After the process is completed, the log file is saved to your current working directory in your terminal or command prompt – typically wherever you opened the terminal.
Option 2: Generate a Watch Dump from a Connected Galaxy Phone
a) On the connected Galaxy phone, dial *#9900#. In the SysDump tool that opens, select DELETE DUMPSTATE/LOGCAT
b) Dial *#9900# again. In the SysDump tool, select DEBUG LEVEL DISABLED/LOW and set it to MID. This restarts the device.
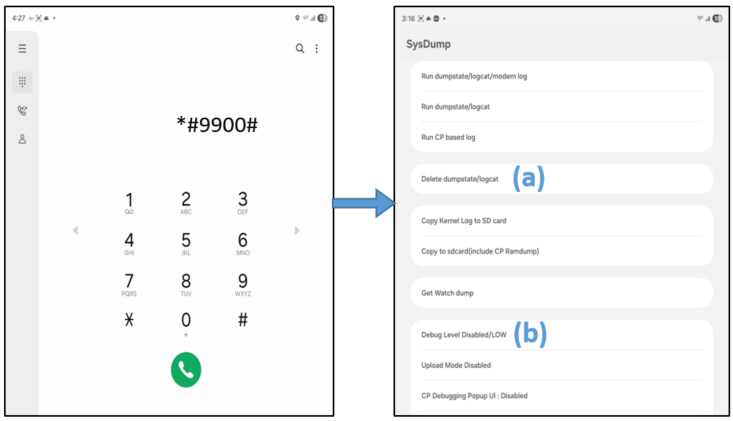
Figure 9: Steps (a) and (b) on a connected Galaxy phone
c) On your Galaxy Watch, reproduce the issue/scenario you want to capture in your log.
d) Back on the phone, dial *#9900# and select Get Watch dump. It will start generating the log, which may take a few minitues. During the process, you will receive toast messages about the process status and completion.
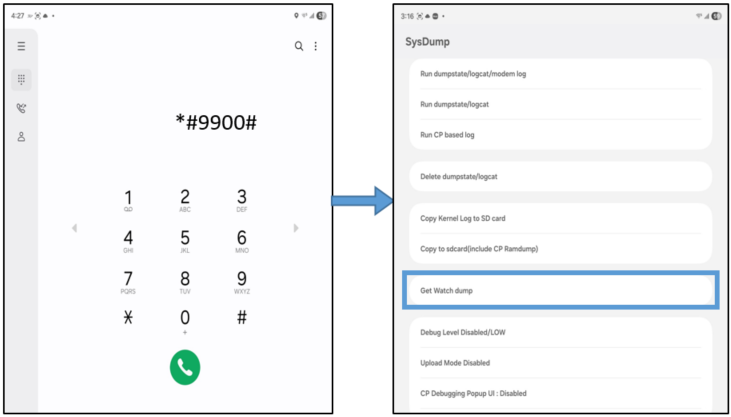
Figure 10: Generate a watch dump from a connected phone
e) After the log is successfully generated, the screen shows the generated log file name and folder path where it has been saved. Generally, you will find it in “My Files” on your phone.
f) Collect the file, which is named in the format “bundled-bugreport-project<date_time.zip>”.
This is the full log file you have just generated. Share the log file with the support team if asked.
Option 3: Generate a Watch Dump Using the Galaxy Wearable Application
a) Enable Developer Mode on the watch (see Figure 1).
b) Connect your watch to the mobile phone using the Galaxy Wearable application.
c) Reproduce the problem on your Galaxy Watch.
d) On your phone, go to the Galaxy Wearable application. Select More > Settings > About Galaxy Wearable.
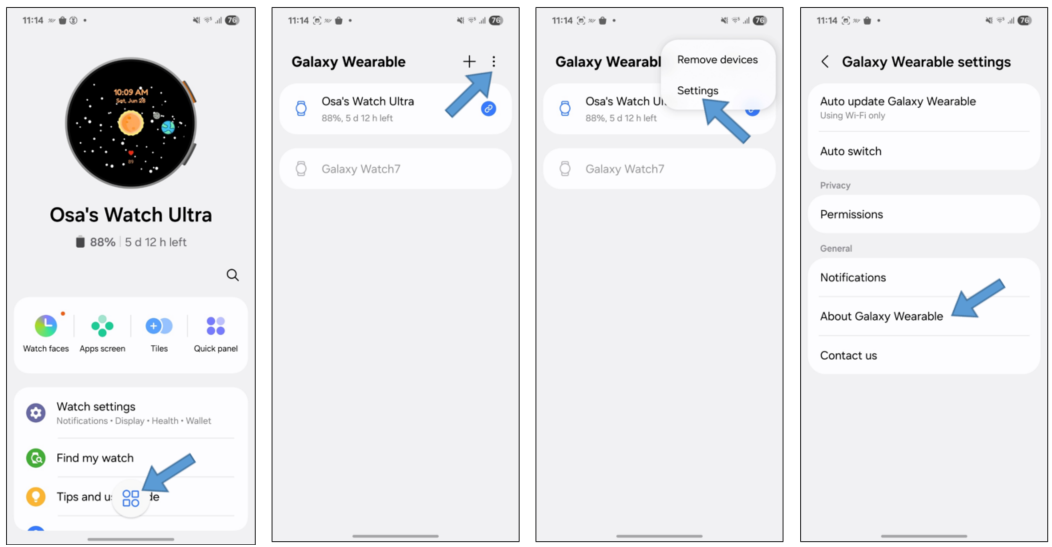
Figure 11: Galaxy Wearable application
e) Tap the "Galaxy Wearable" heading 5 times to open the Wearable Hidden Menu, select Get DumpState, and then Run Watch dump.
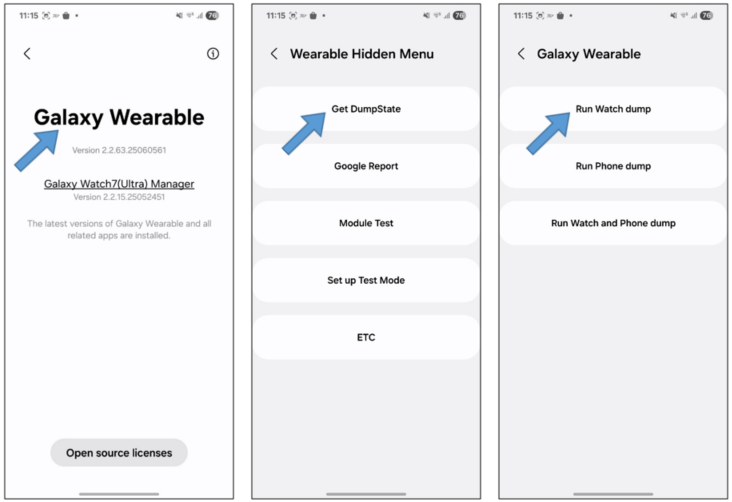
Figure 12: Generate a dumpstate log from the Galaxy Wearable App
f) Wait for the process to finish, which may take a few minutes.
g) After the log is generated, it is written into the phone storage. The storage path is My Files > Internal Storage > Download > Log > GearLog > bundled-bugreport-project<date_time.zip>.
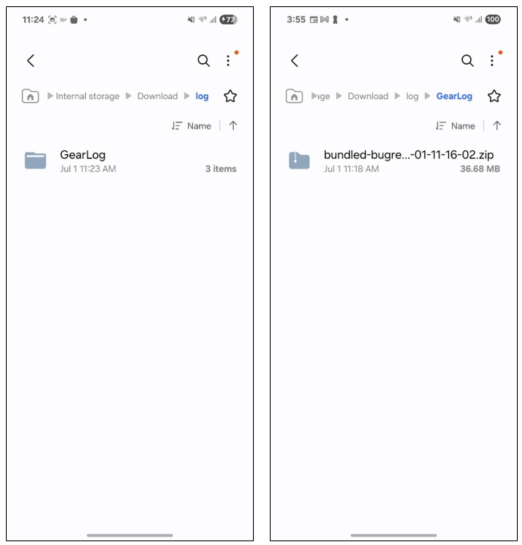
Figure 13: Collecting the log from the phone storage
h) Collect and share the log file with the support team if asked.
Some Important Things to Keep in Mind
- It is better to disable Developer Mode when it is no longer required.
- Set the debugging level back to LOW after completing the log collection.
- If you are a developer, remember that ADB debugging may be used for advanced access.
- Do not move to another screen while generating the dumpstate log. You have to wait for some time for the full process to complete. This may take 1~3 minutes. After completing the full process, a popup notification will be shown.
- If you’re generating a log for a support ticket, follow the exact instructions given by the agent.
- Try to generate the log immediately after reproducing the issue you wish to capture. If possible, generate the log within 10 minutes.
- Check that you have collected the full log file before sending it to the Samsung support agent.
Conclusion
Galaxy Watch always offers flexible ways to collect logs and bug reports to troubleshoot and optimize your applications. Follow one of the options described above, generate your log file, zip it, and share it with Samsung support.
By following this guide, you can confidently access logs, full bug reports, and system information to analyze application behavior, diagnose problems, and take steps accordingly.
Remember to always handle data responsibly and keep debugging options disabled in production environments to protect device security and privacy.
If you have any questions about or need help with the information in this article, you can reach out to us on the Samsung Developers Forum or contact us through Developer Support.