GPUWatch is a tool for observing GPU activity in your application. GPUWatch is made for developers who use Samsung devices
to get GPU related information with the least effort. Detailed information is overlaid onto the screen in real-time.
And it is very simple to enable - no PC required.
In the mobile world, the key to a great user experience is performance with efficiency. Efficient applications have low power
requirements which both improves battery life and keeps the device temperature in a comfortable range. Developers aim to achieve
not only higher performance but also better efficiency through optimization. To reach these goals it is necessary to measure the
current status which is the job of a profiling tool, like GPUWatch. GPUWatch gives information about GPU work, resource allocation,
processor status and more so that developers can get clues about bottlenecks and the best ways to fix them.
Then they can finally get the desired performance. Also, they can evaluate the application in many different environments.
You can utilize GPUWatch in lots of different ways. It’s up to you what you will do using this easily accessible and informative tool.
Supported Devices
Device
Android P GPUWatch v1.0
Android Q GPUWatch v1.5
Galaxy S9 series
△*
✓
Galaxy S10 series
✓
✓
Galaxy S20 series
✓
Galaxy Note9 series
△*
✓
Galaxy Note10 series
✓
✓
Galaxy Note20 series
✓
Galaxy Fold
✓
✓
Galaxy Z Flip
✓
Galaxy Z Fold2
✓
△Only devices launched in Europe and Korea.
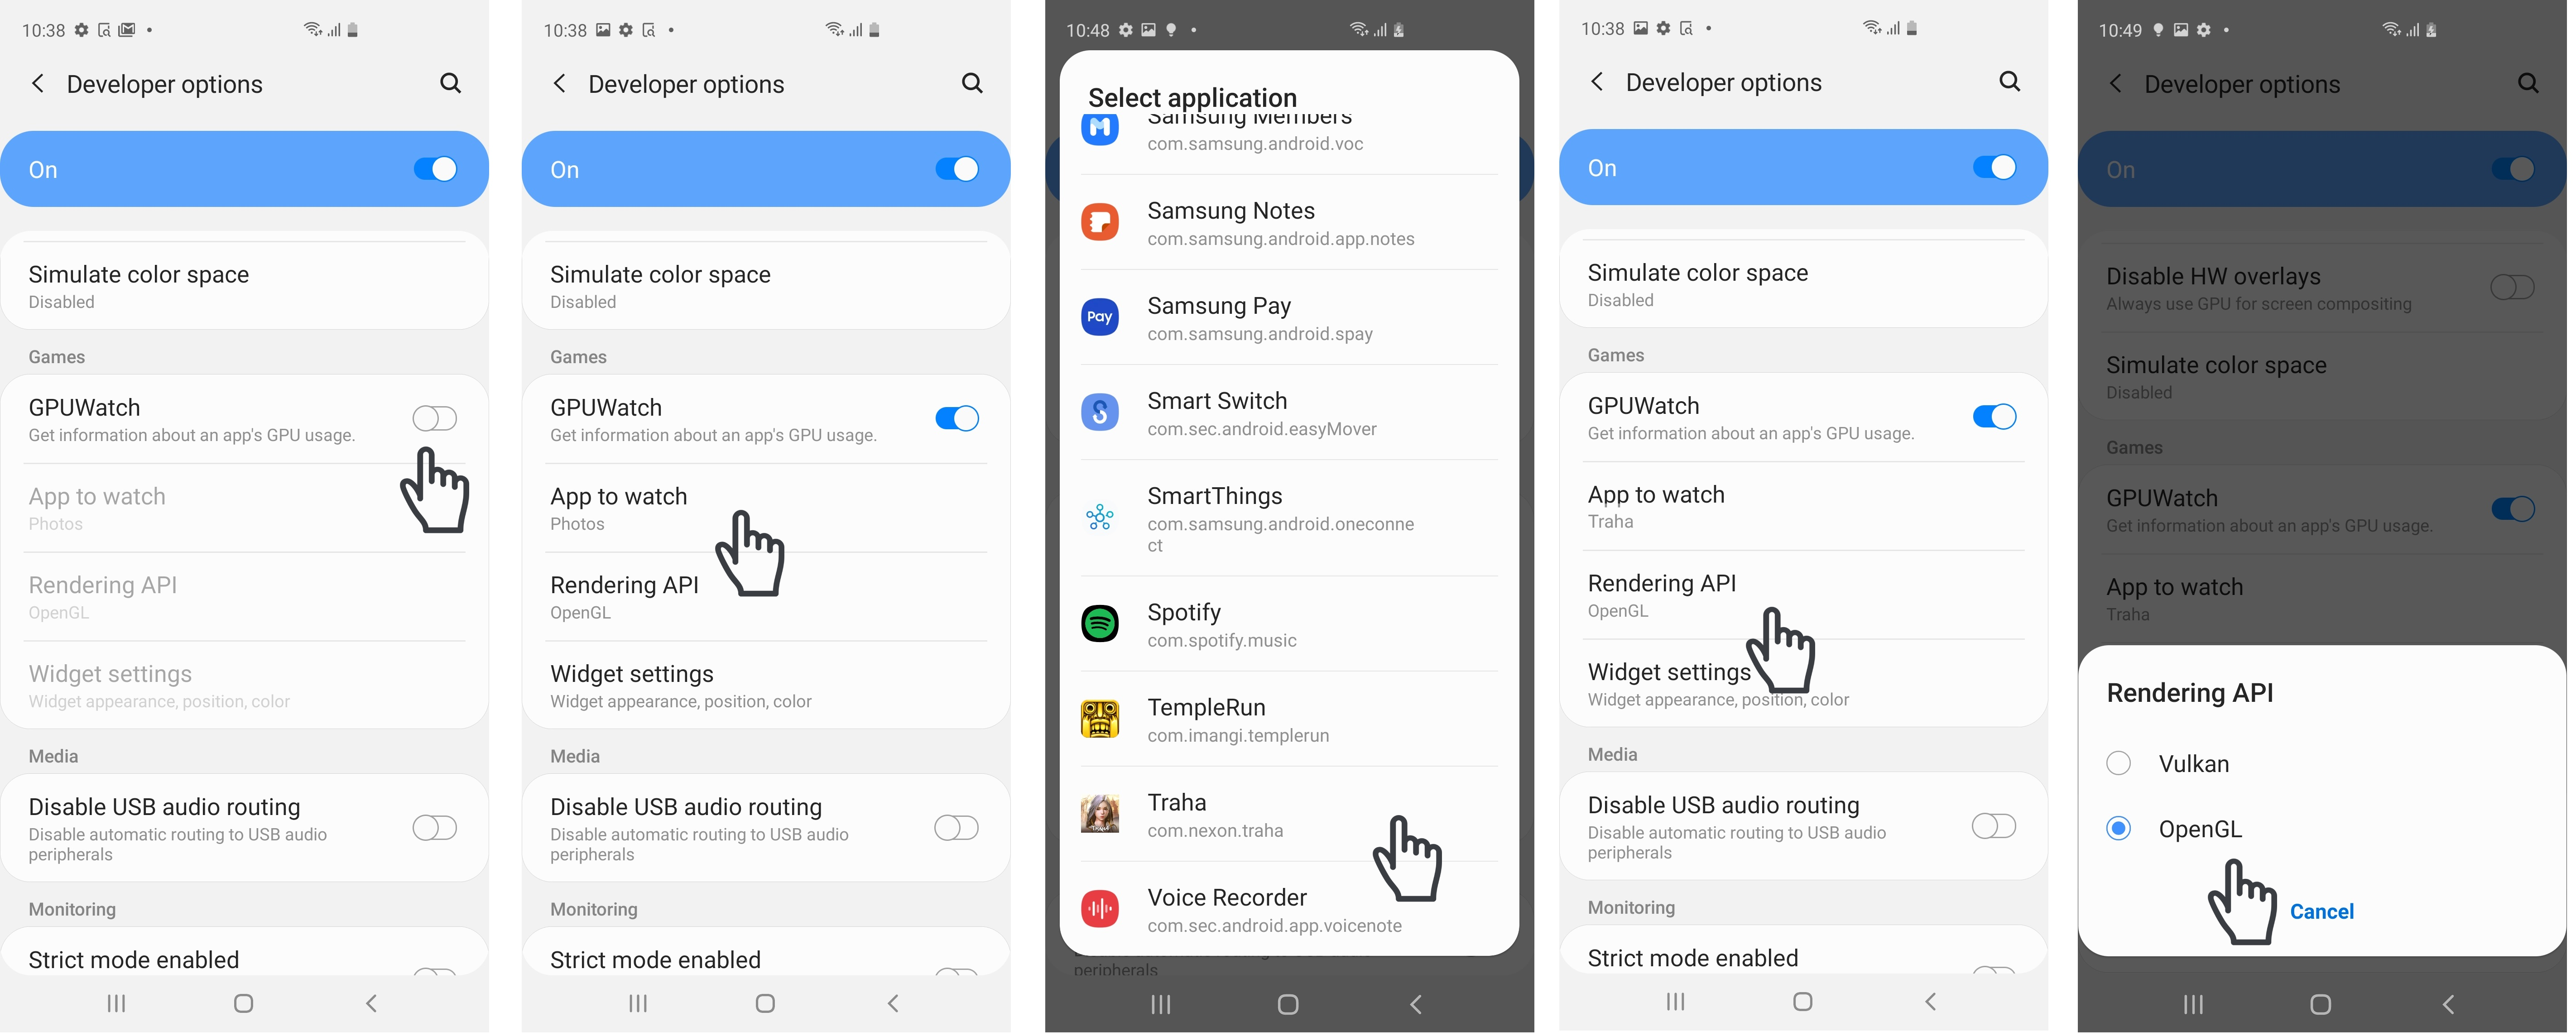
How To Use
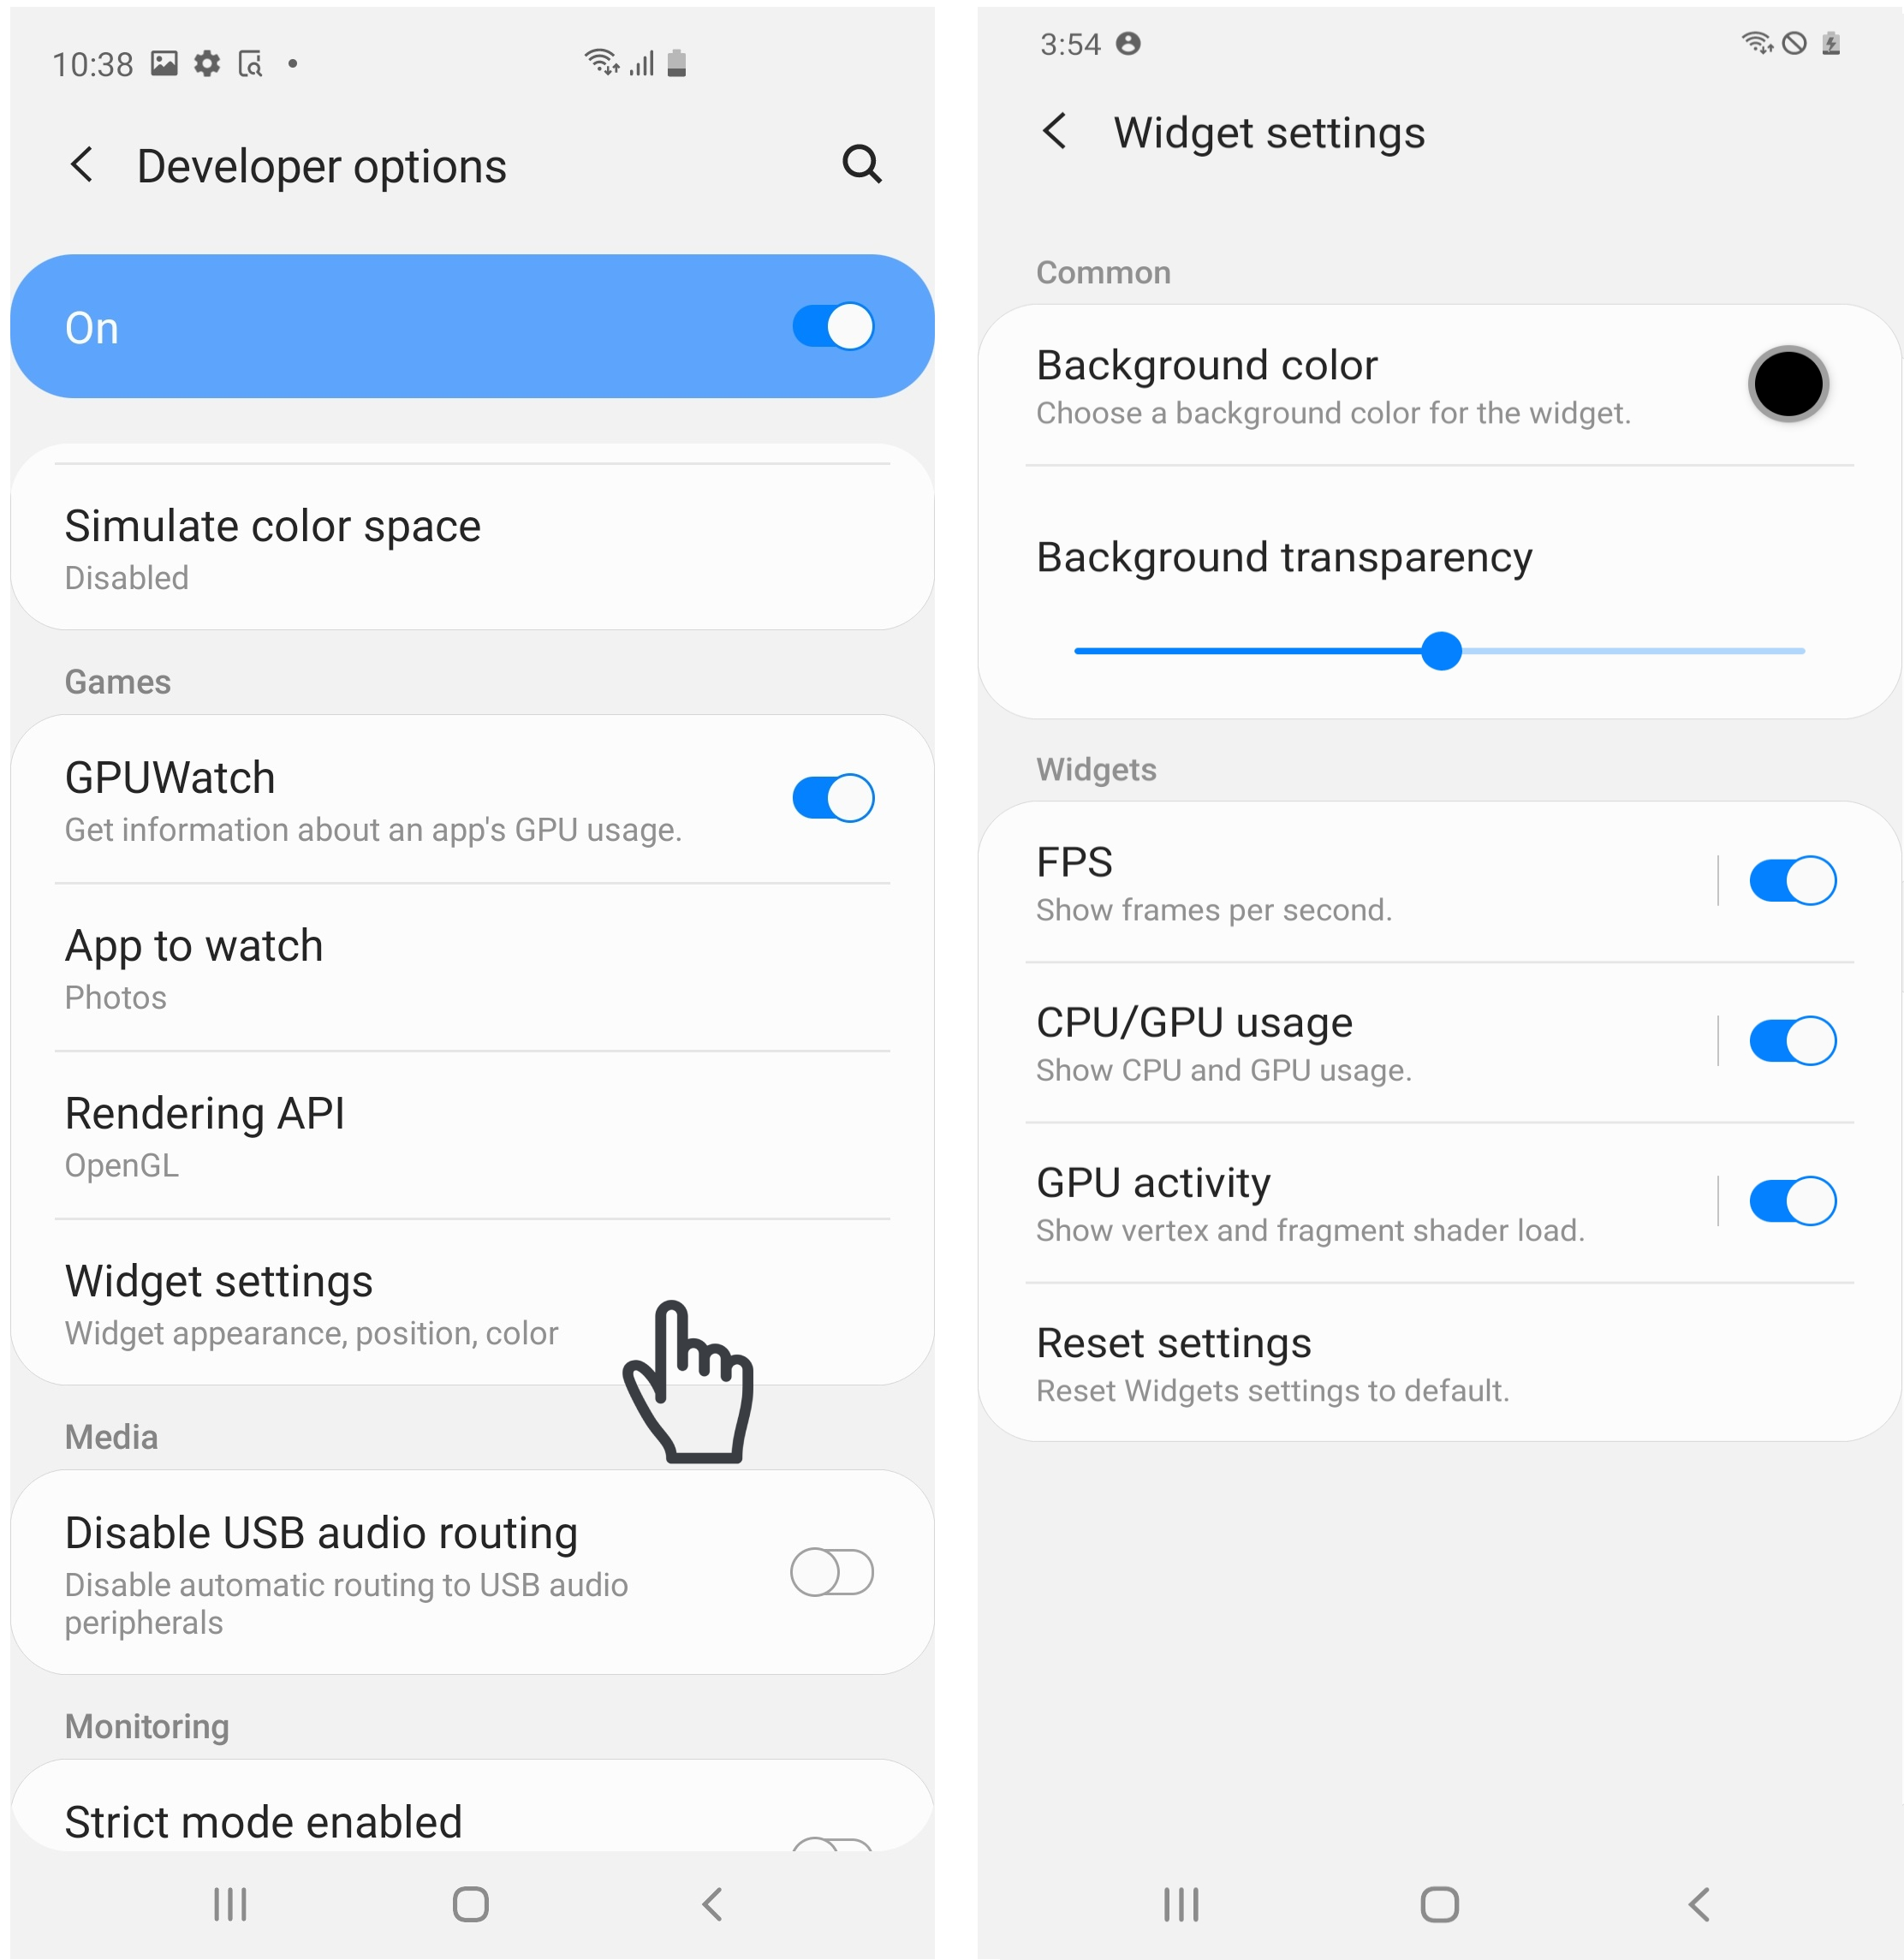
You can easily turn on the GPUWatch overlay for your application:
Setting → Developer Options → GPUWatch On
Select the App to profile
Select Rendering API
Launch the App
If nothing is shown, check whether both application name and rendering API are set correctly.
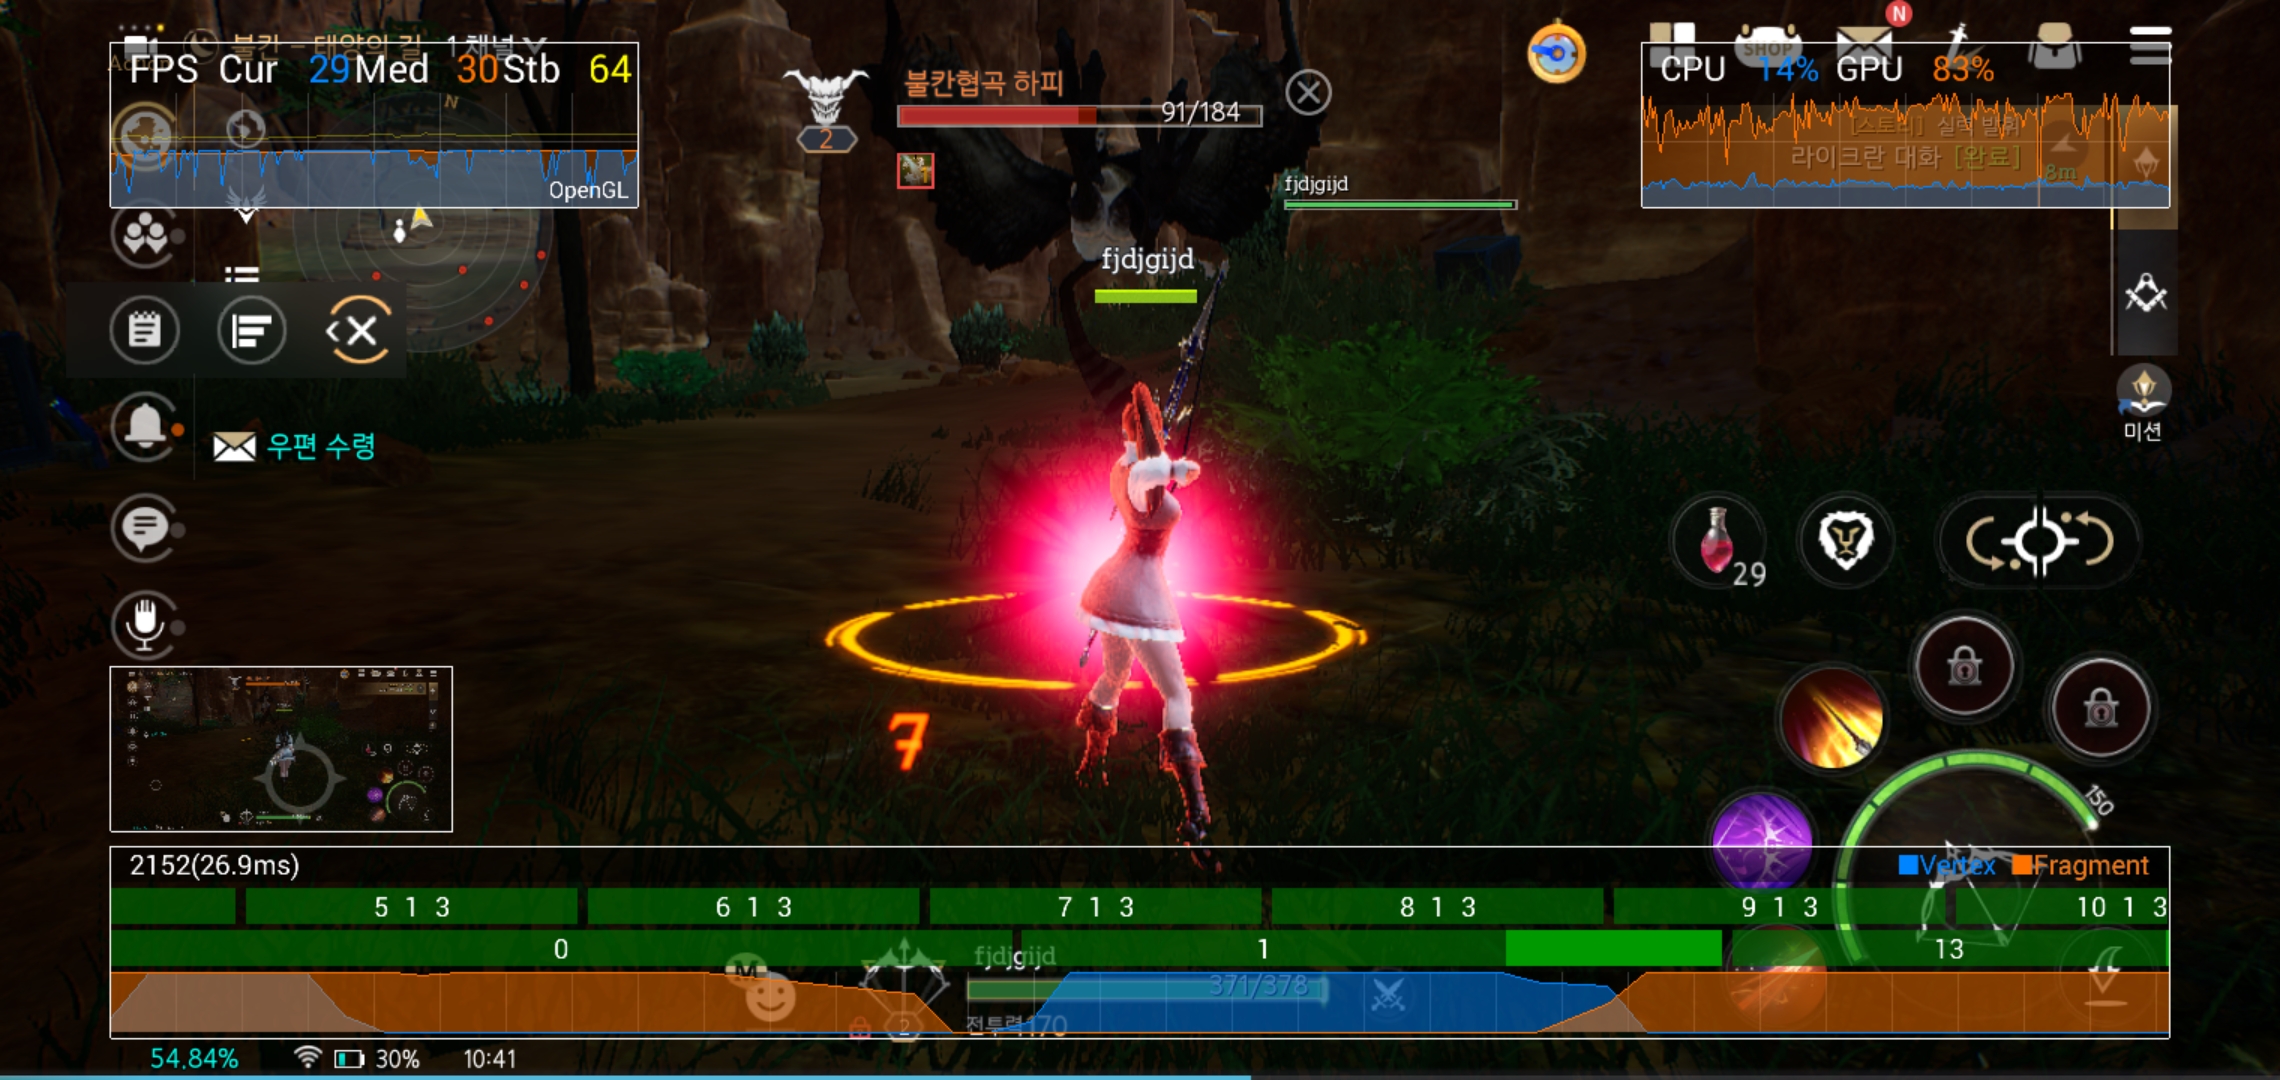
Functionality
Each metric is calculated from values measured over 120ms. The icon ★ marks funtionality that is supported from v1.5 onwards.
FPS
Metric
Description
Cur
Average FPS during recent 120ms
Med★
Median value among all measured FPS since launch When we put FPSs in line in a ascending order, the value at the center is median. Median FPS is calculated as a value rounded to one decimal place.
How to calculate 30 31 38 32 29 35 → 29 30 31 32 35 38 sort → The median is 31.5(average(31,32))
Stb★
TotalFPS to StableFPS ratio as a percentage StableFPS : MedianFps +- MedianFps x 0.2
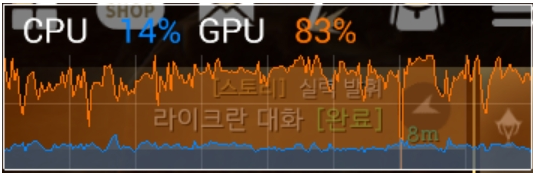
GPU,CPU Usage
Metric
Description
CPU (Total Usage)
CPU working time against total time (working time + idle time) considering load over all CPU cores.
CPU★ (Current Usage)
CPU time of this process including both user time and kernel time. (This is the default instead of 'CPU Total Usage' since v1.5)
GPU
Proportion of working cycles against total cycles of GPU.
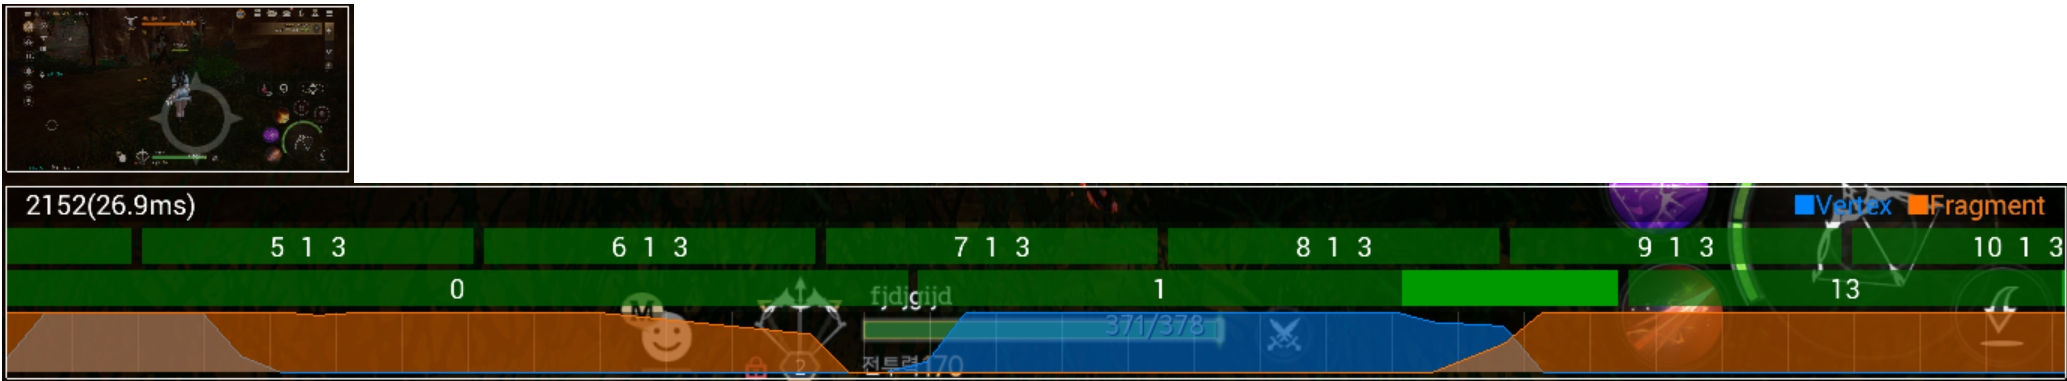
GPU Activity
Frames are captured at a regular time interval. If you want to capture manually, press the Volume Down key.
Metric
Description
Thumbnail
Thumbnail of rendered image.
Scene Info
Frame number since launching and draw time for the frame.
Renderpass Timeline
Proportion of working cycles against total cycles of GPU. This graph draws a box for each renderpass with a size proportional to the draw time for the renderpass in the current frame. Each renderpass is separated with a transparent border. For short renderpasses the index is hidden and the area is shown as a lighter color without border. If many renderpasses exist, graphs are animated with marquee effect.
About index (x,y,z) of graph, x means renderpass index (this may not be exactly matched with FBO id.) y means the count of glDrawCall (glDrawArrays, glDrawElements, glClear for GLES, vkCmdDrawXXX for Vulkan) z means count of vertices
Vertex /Fragment Activity
This graph draws the vertex and fragment workload of each renderpass. The y-axis shows the proportion of the vertex or fragment cycles used compared to the total cycles available. The x-axis matches the “Renderpass Timeline” graph above, which means that the corresponding area of the activity graph with each renderpass of the timeline graph represents the workload of that renderpass.
Configure layout
You can configure layout details including colors and visibility for each widget through the "Widget Settings" submenu of "GPUWatch".
Revision History
Revision
Date
Description
1.0
May 2020
Initial release
Manage Your Cookies
We use cookies to improve your experience on our website and to show you relevant
advertising. Manage you settings for our cookies below.
Essential Cookies
These cookies are essential as they enable you to move around the website. This
category cannot be disabled.
Company
Domain
Samsung Electronics
developer.samsung.com, .samsung.com
Analytical/Performance Cookies
These cookies collect information about how you use our website. for example which
pages you visit most often. All information these cookies collect is used to improve
how the website works.
Company
Domain
Samsung Electronics
.samsung.com
Functionality Cookies
These cookies allow our website to remember choices you make (such as your user name, language or the region your are in) and
tailor the website to provide enhanced features and content for you.
Company
Domain
Samsung Electronics
developer.samsung.com, google.account.samsung.com
Preferences Submitted
You have successfully updated your cookie preferences.