The Tizen Studio TV Extension provides the Web Inspector as a debugging tool. This topic describes how to use the Web Inspector to test applications running on the simulator, emulator, or a target device.
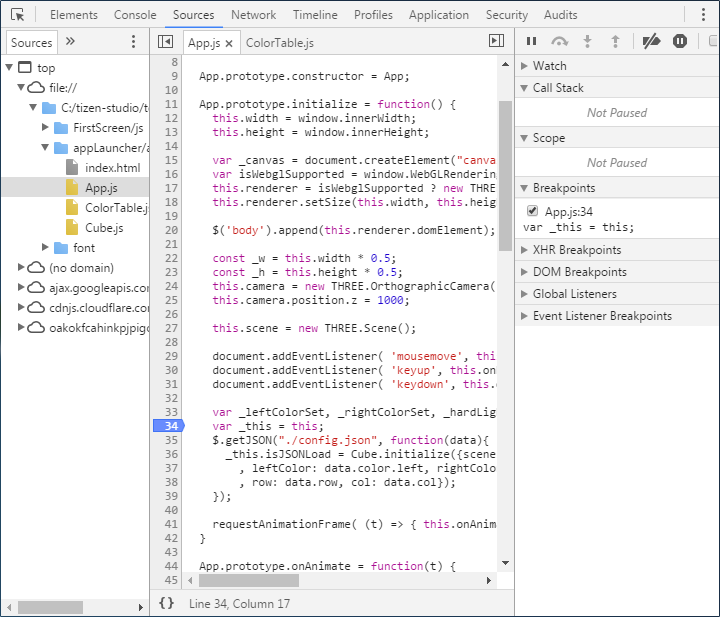
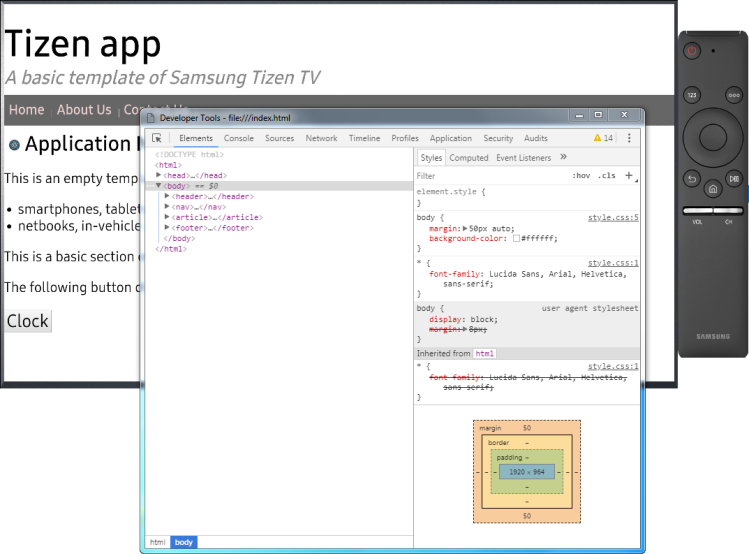
The Web Inspector helps you to debug and optimize your Web Applications. It provides a debugging environment, where you can inspect the CSS and layout of HTML pages, monitor memory and network usage, and pause JavaScript execution and observe the values of variables as they are defined. The Web Inspector features are organized in various tabs.
All Samsung TVs since 2015 support the Web Inspector. It is also fully supported on the TV emulator since Tizen TV Extension 2.1.2.
NoteWeb Inspector measurements can differ between the TV emulator and an actual Samsung TV.
Because the application launches before the Web Inspector does, you cannot use the Web Inspector to check any performance issues, such as memory usage, at the point of application initialization.
Using the Web Inspector
You can use the Web Inspector to debug applications running on the simulator, the emulator, or a target device.
TV Simulator
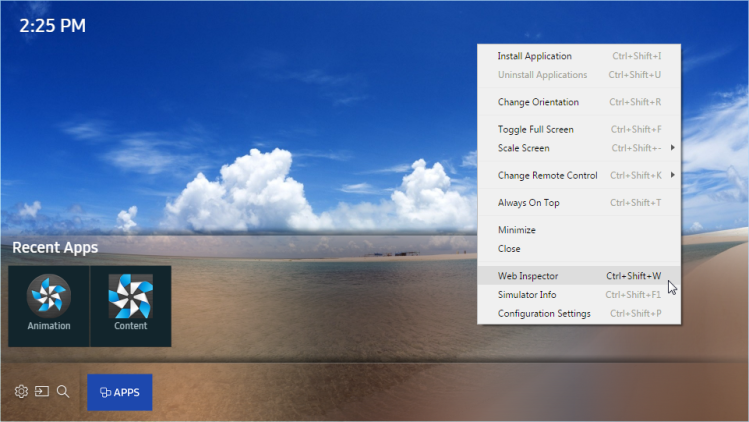
To launch the Web Inspector with the simulator, right-click the simulator and select "Web Inspector".
TV Emulator or Device
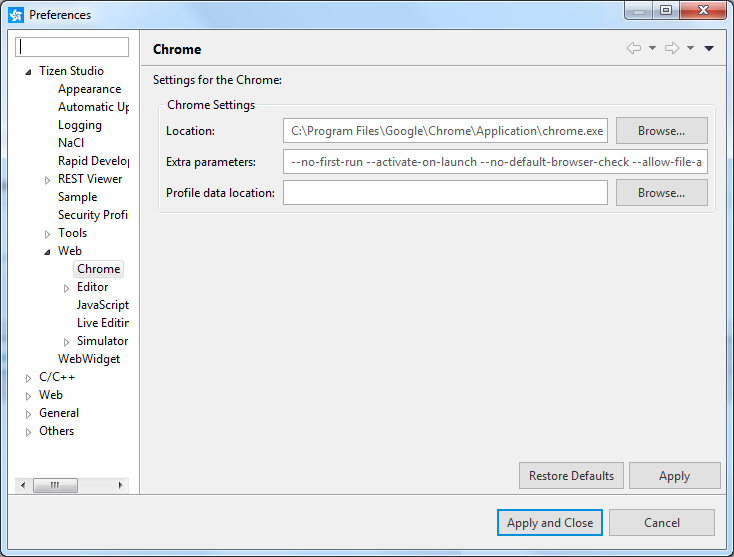
The Google Chrome™ Web browser is required to use the Web Inspector with the TV emulator. Before using the Web Inspector, you must first configure the Tizen Studio settings:
In the Tizen Studio menu, select "Window > Preferences > Tizen Studio > Web > Chrome".
In the "Location" field, enter the path to your Google Chrome™ browser installation. The Tizen Studio automatically detects your installation, but if you have installed the browser in a custom location, you must set the location manually.
In the "Extra parameters" field, enter the following parameters:
In the Tizen Studio Device Manager, right-click the emulator or device, and select "Permit to install application".
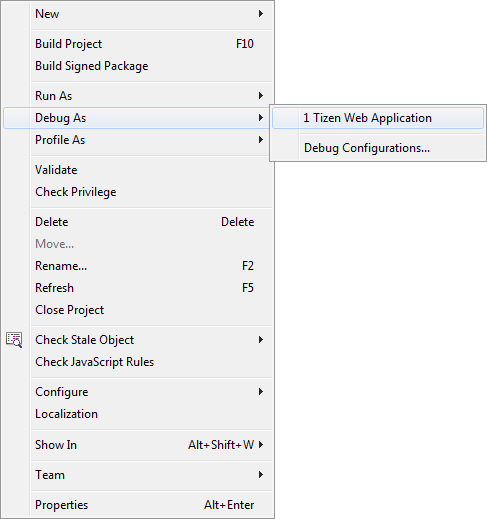
To launch the application in debug mode, in the "Project Explorer" view, right-click on the project you want to debug and select "Debug As > Tizen Web Application".
After the application is installed, it is executed and the Web Inspector is displayed automatically.
To end the debugging session, close the Web Inspector window.
NoteBecause the application launches before the Web Inspector does, you cannot check the JavaScript console log at the point of application initialization.
If you want to inspect the launch process of your application, in the Web Inspector, press F5 to reload the application.
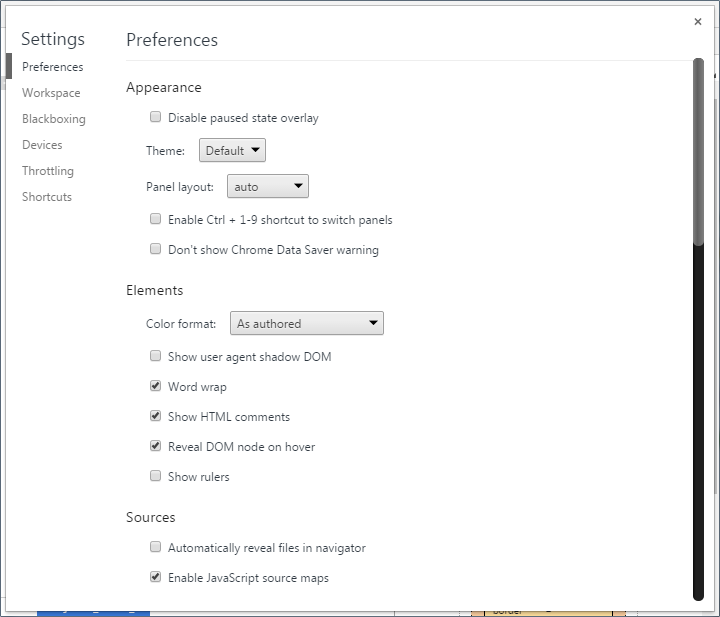
Web Inspector Settings
You can access the internal Web Inspector settings panel and a list of available keyboard shortcuts by clicking the 3 dots icon in the top-right corner of the Web Inspector window, and selecting "Settings".
Known Issues
The Web Inspector has the following known issue:
When debugging remotely on a TV using the Web Inspector, closing the application does not terminate the application process but sends it to the background. To relaunch an application, reboot the TV.
Manage Your Cookies
We use cookies to improve your experience on our website and to show you relevant
advertising. Manage you settings for our cookies below.
Essential Cookies
These cookies are essential as they enable you to move around the website. This
category cannot be disabled.
Company
Domain
Samsung Electronics
developer.samsung.com, .samsung.com
Analytical/Performance Cookies
These cookies collect information about how you use our website. for example which
pages you visit most often. All information these cookies collect is used to improve
how the website works.
Company
Domain
Samsung Electronics
.samsung.com
Functionality Cookies
These cookies allow our website to remember choices you make (such as your user name, language or the region your are in) and
tailor the website to provide enhanced features and content for you.
Company
Domain
Samsung Electronics
developer.samsung.com, google.account.samsung.com
Preferences Submitted
You have successfully updated your cookie preferences.