ImportantDue to NaCl deprecation by the Chromium project, Tizen TV will continue its support for NaCl only until 2021-year products. Meanwhile, Tizen TV will start focusing on high-performance, cross-browser WebAssembly from 2020-year products.
This topic describes how to debug Native Client projects with the Tizen Studio.
You can use the Tizen Studio debugger to test Native Client (NaCl) applications. The NaCl debugger is based on the Eclipse remote debugger. For more information on the remote debugger, see Remote Debugging.
Obtain a Samsung-provided Smart TV developer model.
For more information, contact a Samsung representative by going to "Samsung Apps TV Seller Office > Support > 1:1 Q&A".
NoteYou can also test your application on a retail Samsung Smart TV, but NaCl debugging support is not guaranteed.
To debug the application with the default debug configuration:
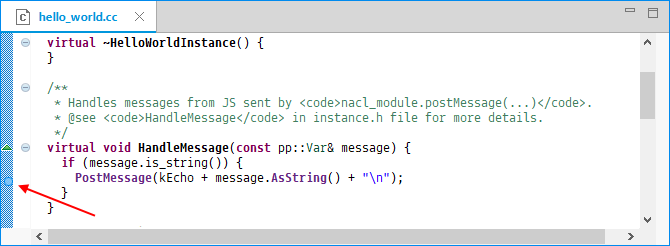
Create breakpoints in the source code by double-clicking in the source code editor left margin.
Launch the debugger:
To debug the application in Google Chrome™, in the "Project Explorer" view, right-click the project and select "Debug As > Webpage in Chrome".
To debug the application on the emulator or a Samsung TV:
In the Tizen Studio toolbar, select the emulator instance or TV from the drop-down menu.
In the "Project Explorer" view, right-click the project and select "Debug As > Widget on a Tizen Device".
Customizing Debug Configurations
You can also customize the debug configuration. The process is similar to customizing the launch configuration.
To create and use a custom debug configuration:
In the Tizen Studio menu, select "Debug As > Debug Configurations".
Create the debug configuration you need:
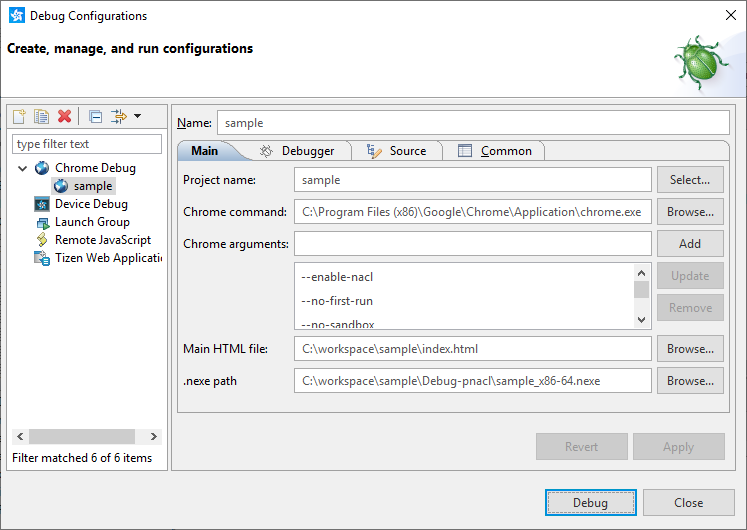
To debug the application in Google Chrome™:
In the side menu, double-click "Chrome Debug".
Enter the configuration name, project name, and main HTML file path, and customize the launch parameters.
In the "Chrome command" field, define the path to your Google Chrome™ executable file location.
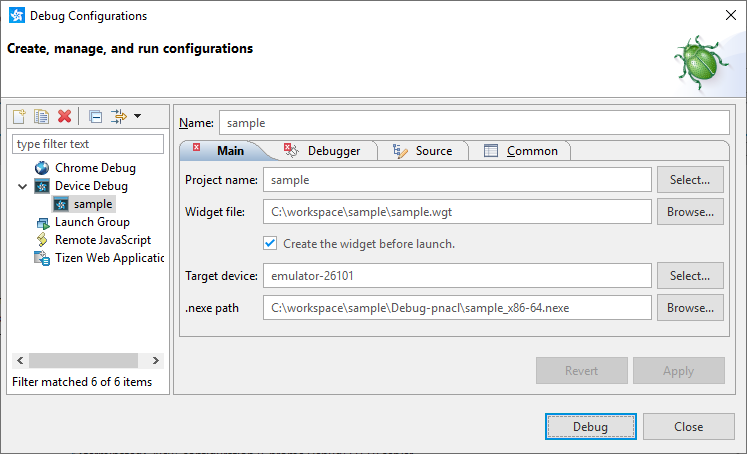
To debug the application on the emulator or a TV, in the side menu, double-click "Device Debug":
Define the configuration name, project name, and ".wgt" file path.
Select the emulator or TV you want to debug the application on.
Define the path to the compiled NaCl module (".nexe" file) in your project.
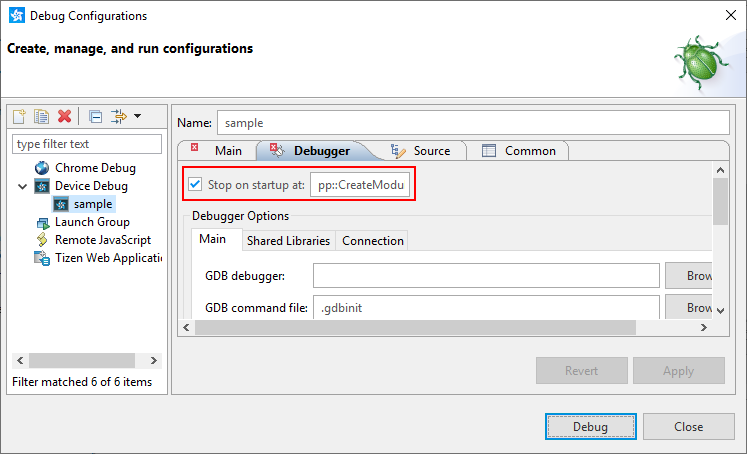
If you want to set a debugging entry point, in the "Debugger" tab, fill the "Stop on startup" checkbox and define the entry function.
ImportantDo not modify the settings in the "Debugger" sub-tabs or the "Source" and "Common" tabs.
To start debugging, click "Debug".
Manage Your Cookies
We use cookies to improve your experience on our website and to show you relevant
advertising. Manage you settings for our cookies below.
Essential Cookies
These cookies are essential as they enable you to move around the website. This
category cannot be disabled.
Company
Domain
Samsung Electronics
developer.samsung.com, .samsung.com
Analytical/Performance Cookies
These cookies collect information about how you use our website. for example which
pages you visit most often. All information these cookies collect is used to improve
how the website works.
Company
Domain
Samsung Electronics
.samsung.com
Functionality Cookies
These cookies allow our website to remember choices you make (such as your user name, language or the region your are in) and
tailor the website to provide enhanced features and content for you.
Company
Domain
Samsung Electronics
developer.samsung.com, google.account.samsung.com
Preferences Submitted
You have successfully updated your cookie preferences.