This topic describes Web Inspector features you can use to help debug and optimize your application.
The Web Inspector provides a debugging environment where you can, for example, control JavaScript execution and monitor various information about your application while it runs.
-
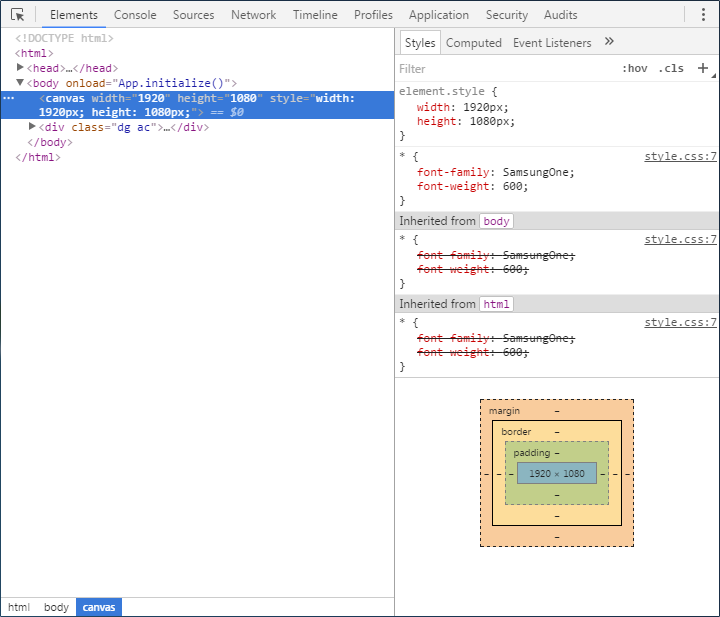
Elements
The "Elements" tab allows you to see the Web page components (the CSS style, event listeners, and properties).
-
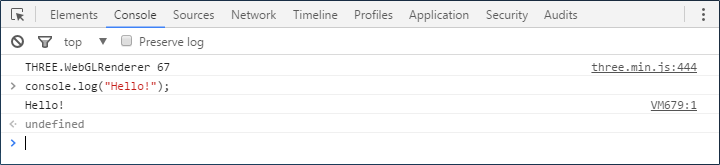
Console
The "Console" tab allows you to inspect the JavaScript console operation. You can interact with your page programmatically. Any errors or warnings on your page are shown in the console.
-
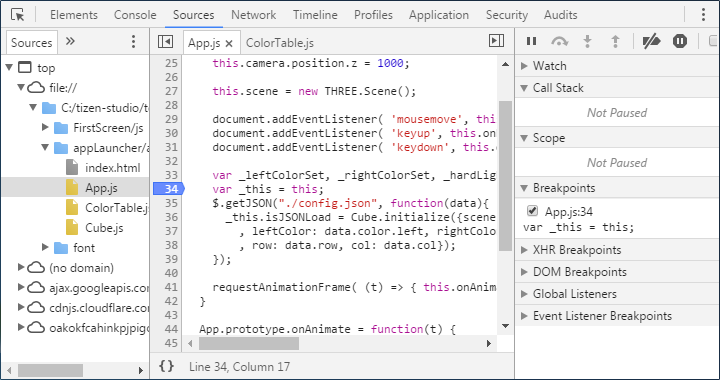
Sources
The "Sources" tab allows you to inspect the JavaScript source page and debug your JavaScript code. This tab supports watch expressions, callstack, scope variables, and break point operation. In addition, it supports basic debugging operations: continue, step over, step into, and step out.
-
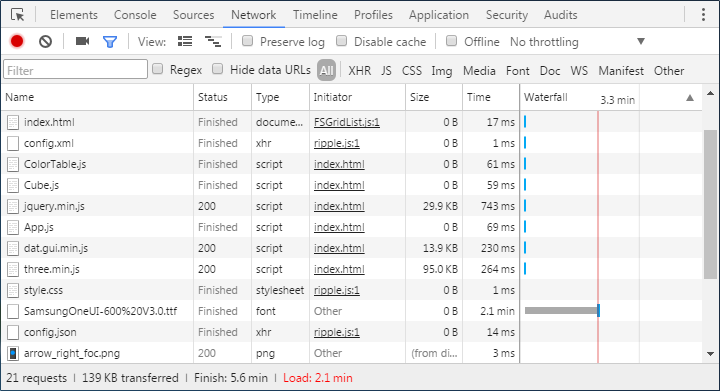
Network
The "Network" tab allows you to inspect resources downloaded over the network.
-
Timeline
The "Timeline" tab allows you to perform advanced timing and speed analysis. You can see how long the browser takes to handle DOM events, and render and paint windows.
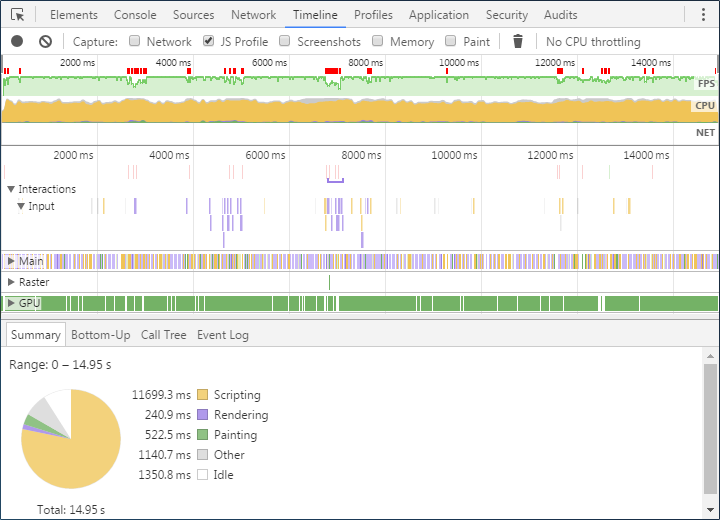
On the timeline, the time spent loading and rendering the application content is shown with colored bars:
- Loading (blue)
Time spent loading HTML content.
- Scripting (yellow)
Time spent loading JavaScript files.
- Rendering (violet)
Time spent rendering content.
- Painting (green)
Time spent loading graphics, such as images and icons.
-
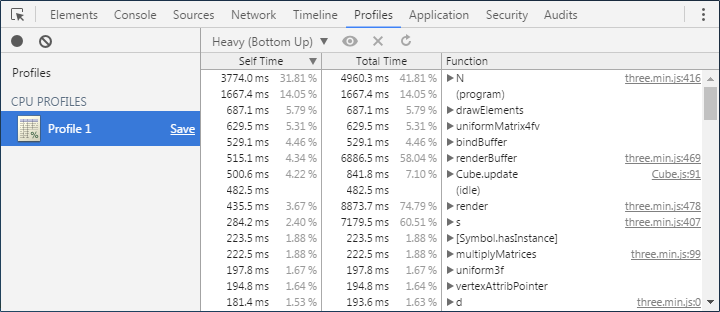
Profiles
The "Profiles" tab allows you to inspect the JavaScript performance analyses. You can inspect CPU, heap, and memory allocation profiles.
-
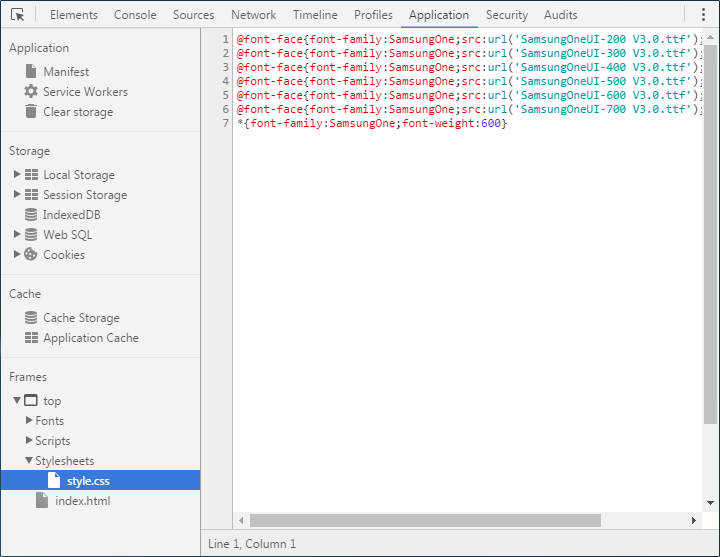
Application
The "Application" tab allows you to inspect resources. You can interact with frames containing resources, such as HTML, JavaScript, CSS, images, and fonts. You can also inspect WebSQL and HTML5 databases, local storage, cookies, and the application cache.
-
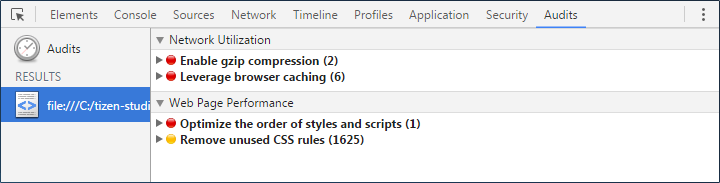
Audits
The "Audits" tab allows you to analyze a page as it loads and provide suggestions and optimizations for decreasing load time and increase perceived (or real) responsiveness.